

Does your towel make you levitate?

Let me talk to you about my favorite towel of my entire life, Peshtemals. But I have to let you know, we’re not going to be talking about how plush it is. It isn’t the thickest towel. It isn’t the softest towel, but it’s still my favorite towel. And it’s for a number of reasons that you wouldn’t know unless you had these towels.

  • fast-drying
  • packable
  • durable
  • stylish
  • more hygienic
  • convenient

But what makes these towels most remarkable is how much they can help you save on your home electric costs!

Peshtemals, also known as Turkish towels, or hammam towels, were created during the Ottoman Empire in modern day Turkey. They are thin cotton towels that are the perfect do-it-all towel for home use, beach use, gym/ spa, etc., and have become popular globally because of their functionality and versatility.

Peshtemals are fast drying, packable and durable. The fabric is made using 100% Turkish cotton, regarded for its long fibers and softness, spun from manually operated looms in Turkey. The cotton is tightly woven, making it strong and highly absorbent without taking up too much space. The tightly spun fibers help repel sand and earth easier than other fabrics making it perfect for beach days or picnics. Their stylish designs make them perfect decorative pieces and furniture covers as well.

When you’re visiting someone’s house, the guest towels are sometimes the thickest, plushest towels, too thick to be useful. You wouldn’t take a thick plush towel to the swimming pool or the beach and put it down in the sand because it would pick up a lot of sand and grime in those thick plush fibers.

You’re already aware of a variety of towels and that certain towels serve certain purposes. Towels can be made of a variety of fabrics including cotton, cotton polyester blends, linen, bamboo, and synthetic microfibers. Cotton is common because it is soft and absorbent, linen is known for its durability, bamboo is prized for its sustainable softness, and microfibers are known to be quick drying.

Peshtemals are more hygienic

Doctors recommend that when drying ourselves off we pat ourselves dry rather than rub. With a plush towel, you can rub the thick sock fibers over your skin with some force to it. But you might not do that with a thinner towel because it might scratch your skin. If you’re not wanting to be abrasive, you would pat.

Doctors also recommend that we should be washing our towels after each use because dead skin and bacteria collect on the towel and grow when it’s hanging on the towel rack. We may be reusing the plush towel for days in a row and then try to dry it out between the days and that doesn’t work because it introduces new bacteria colonies to the skin. So instead of going that way and reusing thick towels, use these thin towels and wash them after each use – you can fit 2 to 3 times as many peshtemal towels in the washer!

Peshtemals are so convenient

You can take it anywhere! For example, in your carry on luggage, you can pack for about three or four days of clothes and towel for each day. You wouldn’t be able to fit four traditional bath towels and have any room left for your clothes. But you can take a peshtemal towel with you because it’s very lightweight. In fact, when I travel, I might take a whole week’s worth of peshtemals in my bag because I’m a swimmer. So I might swim two or three times on that three or four day trip. I might take four towels and clothes for three to four days, all in one carry-on bag. And you just can’t do that with any other towel.

Wanna FREE Makello towel?  Come to Elementary Institute of Science Oct 24, 2026 @ 11am-2pm, and Book an Appointment for Energy Analysis, and securely share your utility data.

Utility Cost Savings

Understanding your energy profile is critically important for being able to take control of your energy independence, so that you don’t have to buy too much solar or too much battery to get to your goal, and your energy profile is affected by usage such as washing your towels.

I’m sure we’ve all experienced over loading the washer with thick, plush towels to the point the spin cycle stops working and the towels are left just sitting in still water. We’re forced to run another wash cycle and sometimes the final spin cycle doesn’t ring out enough water and then we have to leave them in the dryer longer, increasing energy costs even more!

Plush towels increase the electric bill more, especially at times of the year when the solar power isn’t producing as much. If you’re running all this extra power to dry your laundry when it didn’t need to be that wet anyways, there’s an incredible amount of savings in changing your towels.

Instead of three plush towels, you can now wash up to 15 peshtemal towels in one load and the washer will not be overloaded. And when it spins dry, it’ll be much drier. And then the heat pump clothes dryer doesn’t have to go through as long a cycle.

Wanna FREE Makello towel? Come to Elementary Institute of Science, 608 51st Street, San Diego, CA 92114, on Oct 24, 2026 @ 11am-2pm.

Register for Climate Action Week @ EIS here.

When you Book an Appointment for Energy Analysis, and securely share your utility data, you’ll get a FREE Peshtemal Beach Towel: Full length, lightweight, compact, sand resistant weave, and water & energy efficient. Up to 15 towels per large washer!
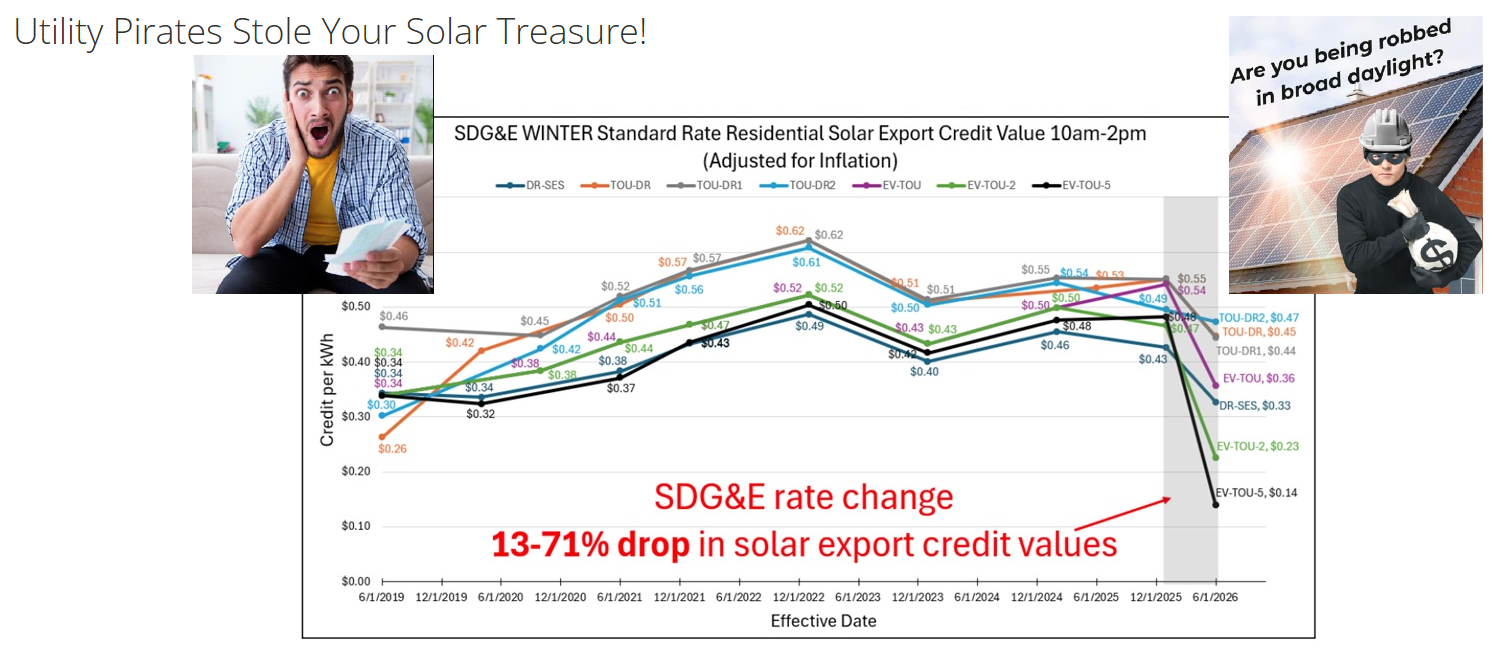
A Measured Impact of SDGE Devastating Export Credit Rate Drop

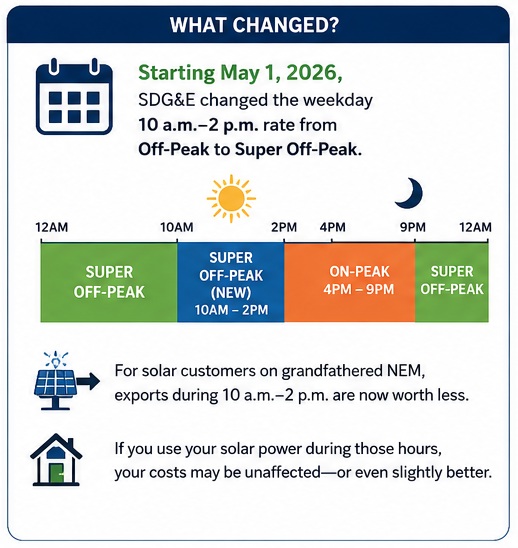
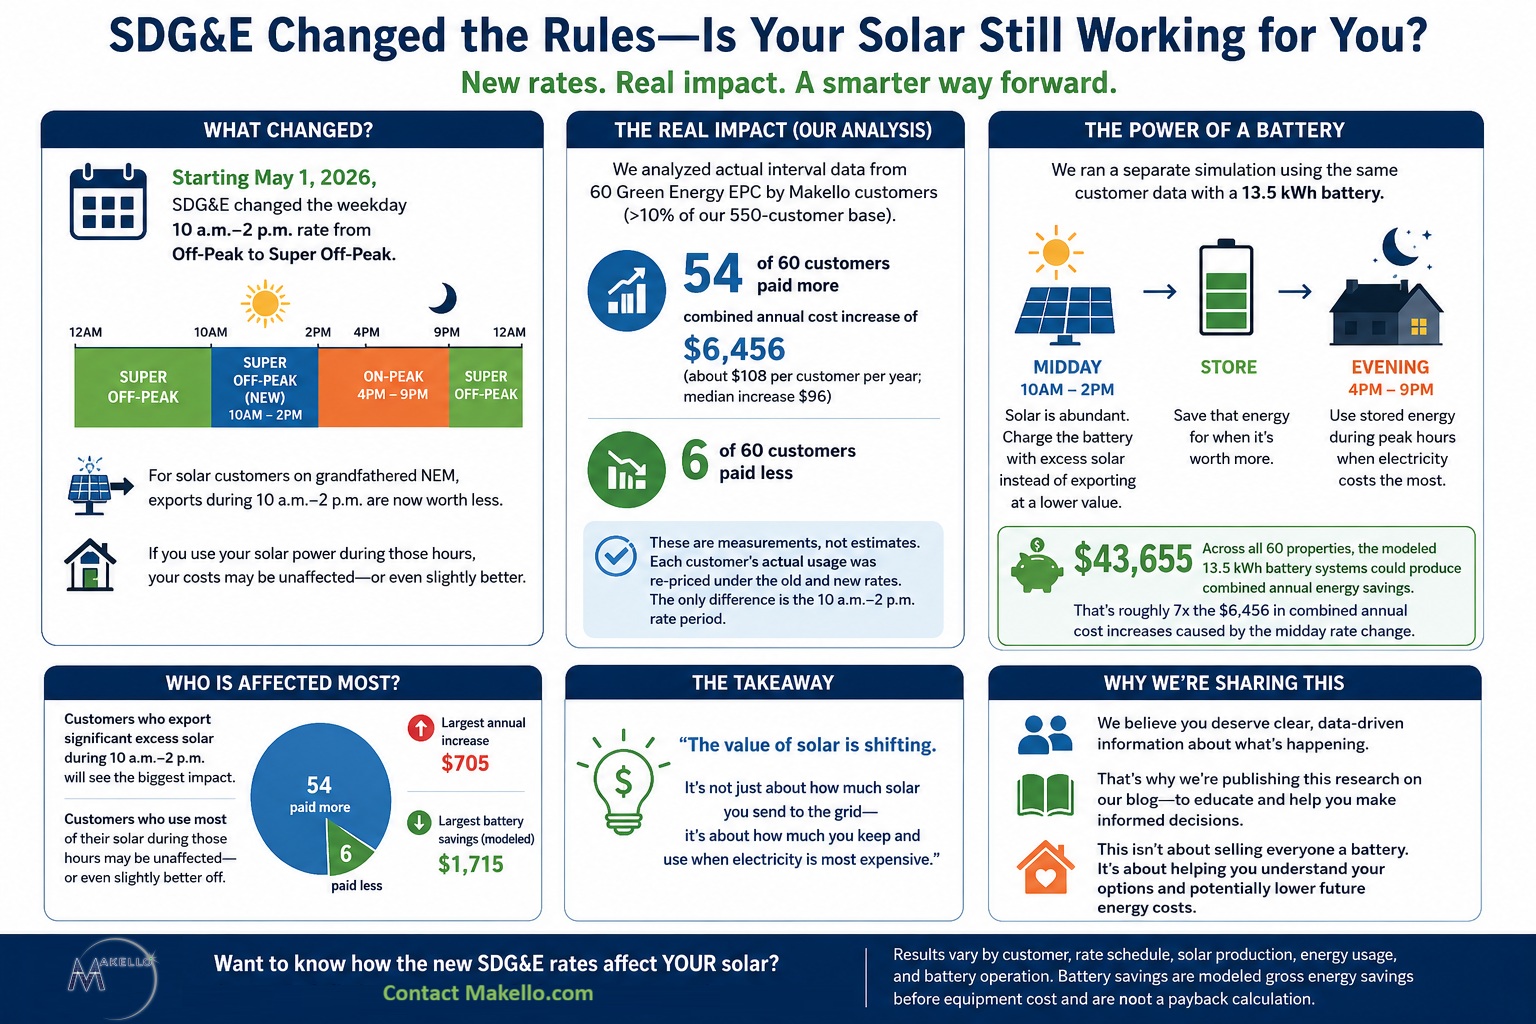
What changed with SDG&E rates?

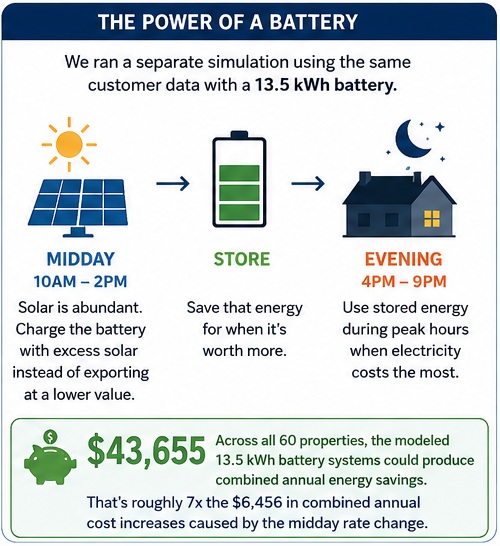
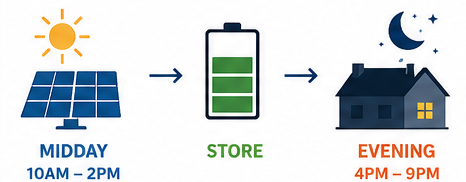
Suggested electric solar-battery usage for Midday solar charging and Peak Rate electric battery consumption.

Effective May 1, 2026, SDG&E replaced the weekday Off-Peak rate with Super Off-Peak rate between 10am and 2pm year round. Previously those midday solar peak production hours were credited for Export to SDG&E at Off-Peak rate credit value, in every month except March and April.  SDG&E On-Peak rate remains 4pm to 9pm.  Weekends remain on the same Super Off-Peak rate as before during midday 10am-2pm. 

For a customer on grandfathered Net Energy Metering (NEM) tariff, moving the lowest cost Super-Off Peak rate to the peak solar production hours cuts the export value. Accounts with loads that consume solar power midday instead of exporting solar power to SDG&E, are unaffected or slightly better off, because the cost of importing electricity during those hours became cheaper.

SDG&E 10am-2pm Super Off-Peak Rate Change: Measured Impact Across the Customer Base

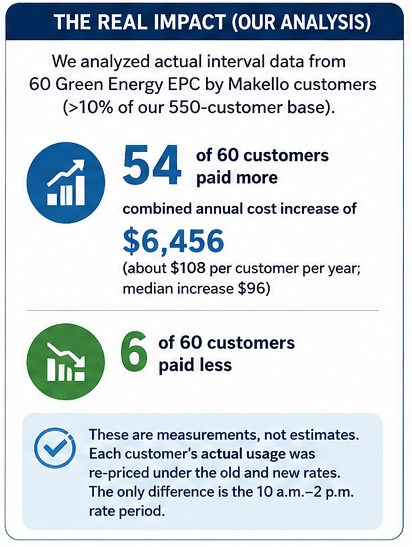
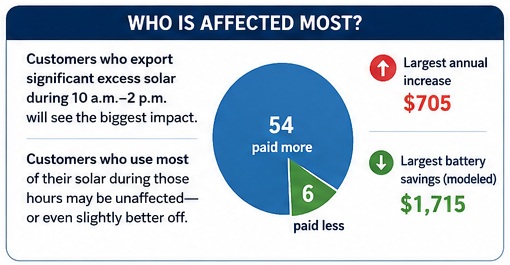
The Center for Community Energy and Makello.com analyzed 60 Green Energy EPC by Makello installed solar or solar-battery customer’s SDG&E metered interval data, which is slightly more than 10% of Green Energy EPC by Makello’s 550 installed customer base.  Fifty-four of the 60 accounts analyzed will pay more because of the change SDG&E made on May 1, 2026, and only 6 pay less. The combined increase is $6,456 a year, however the same 60 properties would save $43,655 a year with the addition of a 13.5kWh battery, which is about 7 times the cost of the Super Off-Peak midday period change that decreased the Solar Export Credit Value.

How were the numbers produced?

Each premise’s own metered intervals were re-priced twice, once under the Off-Peak rate, and once under the Super Off-Peak rate. The electric load, utility rate and the  solar or solar-battery system are the same in both runs. The only difference is which SDG&E rate the midday hours fall, so the difference between the two runs is caused by the period change and by nothing else. These are measurements, not estimates. 

Under Net Energy Metering (NEM), each period’s net kilowatt hours (kWh) settles at that period’s generation rate. Delivery is close to flat across periods and earns no credit on export, so it is unaffected by the change and drops out.

The whole bill moves by the amount shown below. 

SourceNumber of Meters MeasuredNumber with higher SDG&E billAnnual Cost Increase
Green Button 1111$1,253
UtilityAPI4943$5,203
Combined6054$6,456

The potential add-on battery figure is a separate simulation on the same interval data, for charging the battery from solar surplus, and discharging the battery against the 4pm to 9pm Peak Rate. 

Annual increase for Existing Solar SDG&E AccountsNumber of Meters MeasuredAnnual Utility Cost Increase for 10am-2pmAdd-On Battery Annual Savings for 10am-2pm
Over $3001$705$1,715
$200 to $3004$1,017$4,653
$100 to $20023$3,265$19,104
$50 to $10020$1,530$14,269
Under $5012-$61$3,914

Every measured meter, sorted by Annual Cost Increase

CustomerCityCCAScheduleSuper Off-Peak rate change Cost / (Benefit) per year 10am-2pmPotential Annual Battery Cost Savings 10am-2pm (13.5 kWh example)
C.B.El CajonSDCPDR-SES$705$1,715
E.L.EncinitasSDCPTOU-DR$288$1,000
D.D.San DiegoSDCPDR-SES$267$1,702
P. F.EncinitasSDCPDR-SES$236$810
E.W.EscondidoCEADR-SES$226$1,141
K. J.La MesaSDCPTOU-DR1$194$728
M.D.EscondidoSDCPDR-SES$191$807
B.B.OceansideCEAEV-TOU-5$188$970
R.C.OceansideCEATOU-DR1$183$625
C.D.CarlsbadCEADR-SES$180$683
C.P.AlpineSDCPTOU-DR1$172$1,103
L.W.San DiegoSDCPDR-SES$168$509
S.P.La JollaSDCPDR-SES$157$1,351
G.S.San DiegoSDCPEV-TOU-5$156$873
R.W.San DiegoSDCPTOU-DR1$154$1,032
J.Z.EscondidoCEATOU-DR1$150$1,164
C.C.San DiegoSDCPEV-TOU-5$131$1,208  
D.M.EncinitasSDCPDR-SES$127$768
G.B.San DiegoSDCPDR-SES$124$1,180
R.D.El CajonSDCPTOU-DR1$118$661
O.T.San DiegoSDCPDR-SES$113$938
E.H.La MesaSDCPDR-SES$113$568
S.B.Chula VistaSDCPDR-SES$113$482
M.D.Rancho Santa FeSDCPEV-TOU-5$112$864
R.G.FallbrookSDCPTOU-DR1$110$393
J.G.San DiegoSDCPEV-TOU-5$106$956
A.K.San DiegoSDCPTOU-DR1$104$658
S.M.EncinitasSDCPEV-TOU-2$101$583
T.W.EncinitasSDCPTOU-DR1$99$638
L.G.CarlsbadCEAEV-TOU-2$96$544
D.Y.EncinitasSDCPTOU-DR1$96$698
D.M.EncinitasSDCPEV-TOU-5$89$254
E.M.CarlsbadCEATOU-DR$89$814
C.C.EscondidoSDCPTOU-DR1$89$900
J.S.La JollaSDCPDR-SES$88$430
J.O.EncinitasSDCPTOU-DR$85$974
M.M.EncinitasSDCPEV-TOU-5$80$951
C.W.San DiegoSDCPDR-SES$79$675
E.B.San DiegoSDCPTOU-DR1$76$634
E.S.EncinitasSDCPTOU-DR1$76$877
D.M.San DiegoSDCPEV-TOU-2$74$797
S.G.La MesaSDCPDR-SES$72$1,041
N.G.EncinitasSDCPTOU-DR1$68$628
T.G.EscondidoSDCPDR-SES$57$639
D.S.EncinitasSDCPTOU-DR$56$587
A.J.EncinitasSDCPEV-TOU-5$55$655
A.S.EncinitasSDCPDR-SES$53$971
A.B.San DiegoSDCPTOU-DR1$53$562
L.B.San DiegoSDCPEV-TOU-5$43$460
J.P.El CajonSDCPTOU-DR1$39$642
C.P.San DiegoSDCPTOU-DR1$38$923
P.H.San DiegoSDCPTOU-DR1$35$360
T.U.Spring ValleySDCPDR-SES$26$84  
D.G.EncinitasSDCPTOU-DR1$12$437
S.M.VistaSDCPTOU-DR1($1)$299
B.R.Del MarCEATOU-DR1($4)$214
C.B.CarlsbadCEADR-SES($9)$12
B.G.La JollaSDCPTOU-DR1($27)$349
A.A.EncinitasSDCPTOU-DR1($63)$40
A.E.La JollaSDCPEV-TOU-5($150)$94 

What the numbers say- Only midday exporters are hurt, making a battery even more useful

The median SDG&E increase is $96 a year and the mean is $108. Clean Energy Alliance(CEA) customers are hit harder per meter, on average $122 annual increase, vs  $105 annual increase for San Diego Community Power(SDCP) generation customers.  The reason for the difference between the two Community Choice Aggregators (CCA) is because the gap between Clean Energy Alliance’s(CEA’s) Off-Peak and Super Off-Peak rates is wider than the gap between San Diego Community Power’s(SDCP’s) Off-Peak and Super Off-Peak rates. 

Only 6 utility meters are better off with the midday rate change, by as much as $150 a year, because they import or self consume at midday instead of exporting, so cheaper Super Off-Peak rate helps them. The dividing line is whether the array is sending excess solar power to the grid at midday, or otherwise that the electric loads are consuming the solar power. A battery is a load that absorbs the excess solar production and stores it for use later when utility rates are higher, or when there is a utility outage.  

How each customer’s CCA was determined

The generation provider matters, since Clean Energy Alliance(CEA) and San Diego Community Power(SDCP) price the affected hours differently. The pricing difference was resolved two ways. First, the best resolution is reading the generation supplier from their own bills. From our sample data, forty-one of the forty-nine UtilityAPI meters’ intervals were read directly from the supplier named on their own bills. That is ground truth and needs no assumption. The remaining 8 were assigned by town, on the basis that Community Choice Aggregator(CCA) membership enrollment is automatic and only 1%-2% of customers choose to opt out. 

The town to CCA map was derived from the bills of the other customers rather than from general knowledge, then checked against the identified customer. Cross checking the data this way caught two errors. The word Vista appears inside Chula Vista, which would have put seven San Diego Community Power customers into Clean Energy Alliance. Escondido turns out to be genuinely mixed, with both suppliers serving different Escondido addresses in the bill data, so the Community Choice Aggregator (CCA) cannot be reliably assigned solely by town name. Escondido and Vista addresses default to SDCP if billing information is not available, which produces a more conservative result.

Data that was excluded from our sample and why

Nine meters were not included in the analysis. Five meters did not have any interval data. Two meters did not have a resolvable supplier or a recognisable town indicated on their interval data. One meter is served by a third party rather than a CCA so these rates do not apply, and one meter was a duplicate.

Additionally, twenty solar exporters are on tiered or two period schedules that the recent SDGE Super Off Peak Hours change does not impact. Two solar exporters are on tariffs that could not be classified. Where a premise had several meters over time, through a meter change or a replacement, only the most recent was counted. For example, three different meters over time at one address would otherwise have counted that customer three times.

Analysis Assumptions

Whenever the numbers above are quoted we used annual netting rather than monthly banking with a true up. With regards to the battery impact, battery dispatch is a simple rule, charge from surplus and discharge against the on peak window, so it is a working figure rather than an optimised one. Delivery is treated as flat across periods, which the bills support. Battery savings are gross energy savings before equipment cost, so they are a savings side and not a payback. Where a customer’s interval history is shorter than a year, we scaled the result to a year, and the number of days behind each figure is in the underlying data.

Key Takeaways

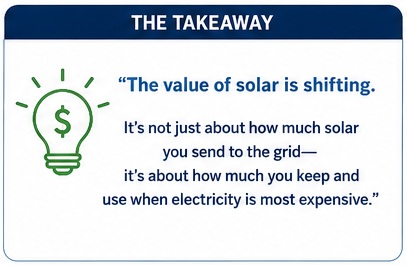
California has the enviable position of producing so much excess solar at noon that there often aren’t enough loads to utilize the solar production being pushed out to the grid. Switching from a spinning the meter backwards to earn credits mindset to using a battery to capture excess production and discharge the battery during on-peak periods can be a game changer for solar customers now that those midday export credits have been devalued.

The goal is no longer to indiscriminately export excess to the grid during high solar production periods but rather to utilize energy storage to hold excess production onsite and discharge the battery during the periods of the day with the most expensive rates with onsite loads prioritized before excess is exported to the grid.

Thank you, Jose and Center for Community Energy, for the excellent research and analysis!
Makello is an authorized distributor for Green Energy EPC by Makello, Inc. CA Lic #1110498

Can Your Home-Based Business Qualify for Solar + Battery Tax Credits?

If you own a business and work from home, your solar and battery installation may qualify for significant federal tax credits and rebates.

Many business owners don’t realize that the business-use portion of their home can unlock commercial clean energy incentives through the federal 48E tax incentive structure, potentially allowing them to claim a substantial percentage of the system cost.


How Business Use Qualification Works
If part of your home is used for business purposes, the solar and battery system may qualify proportionally based on either:

● Square footage used for business

● Percentage of total energy use attributed to the business

This means business use may qualify for up to 78% solar-battery incentives proportionally, depending on your tax structure and eligibility.

For example:
If 40% of your home’s energy use supports your business operations, your eligible incentives may apply to that 40% business-use portion.


Incentives for Non-Profit Organizations
Eligible non-profit organizations may qualify for:
Federal Incentives

● 30% Solar Tax Credit (as a rebate)

● +10% Domestic Content

● +10% Energy Community

Total Potential Benefit
Up to 50% Rebate × Business Use %
This can significantly reduce upfront costs for qualifying churches, schools, charities, and other nonprofit entities operating from owned properties.


Incentives for For-Profit Organizations
Eligible for-profit businesses may qualify for:
Federal Incentives

● 30% Solar Tax Credit

● +10% Domestic Content Tax Credit

● +10% Domestic Content Tax Credit

● +15% to 28% Depreciation

● Based on tax filing category

● Gross income

● Depreciation method used

Total Potential Benefit
Up to 65%–78% Tax Credit × Business Use %
This makes solar + battery systems one of the most powerful tax-advantaged investments available for business owners.


Who May Qualify?
Home office or business-related usage on a residential meter may qualify if the business generates income from one of the following:

● Self-employed individuals reporting business income on Schedule C

● Independent contractors

● Sole proprietors

● Single-member LLCs taxed as sole proprietorships

● Partners in partnerships (subject to specific rules)

● S-corporation shareholders (via corporate accountable plan reimbursements)

Important Note
A remote employee working from a home office cannot claim Business Use deduction. However, an employee-owner may qualify depending on structure and reimbursement setup.


How to Reserve Federal Tax Credits


To qualify for Federal Income Tax Credits and Depreciation for Business Use:

Option A
Pay a minimum of 5% of the Gross Cost by July 4, 2026
to reserve the tax credit and install by 2030.

Option B
Pay a $1,000 Down Payment
and install by December 31, 2027.

These timelines may help preserve eligibility under current federal incentive programs.


Why This Matters

Solar + battery systems are no longer just energy upgrades—they are strategic financial tools. For business owners working from home, the right system structure may deliver:

● Lower utility costs

● Backup power security

● Major federal tax savings

● Accelerated depreciation benefits

● Improved long-term property value

Understanding your business-use percentage can make a major difference in total savings.


Disclaimer: Makello.com and Green Energy EPC by Makello, Inc. are not tax experts.
This article is for informational purposes only and is not tax advice. We cannot guarantee incentive acceptance, fund availability, or final incentive amounts. Please consult your CPA or tax professional regarding your specific eligibility for business-use solar incentives on residential or commercial properties.

Reserve Up to 78% Solar-Battery Incentives by July 4, 2026!

Safe Harbor for Solar & Battery Incentives in 2026: What Owners Need to Know

If you’ve been thinking about adding solar or battery storage to your property, 2026 brings a mix of opportunity and urgency. The landscape has shifted significantly over the past two years, and understanding what’s changed could make a substantial difference in your long-term savings.

The Big Change: Tax Credits in 2026

● Residential personal-use 30% solar and battery tax credits ended in 2025.

● However, solar and battery systems tied to Business Use are still eligible for tax credits in 2026, and these projects can be reserved now and built through 2030.

This means both commercial properties, and residential properties where homeowners who can legitimately classify part of their energy usage as business-related, such as a home office, rental activity, or EV used for business, may still qualify for meaningful incentives.

Why Timing Matters

There is a critical window to act. Contracts signed and a minimum of 5% Safe Harbor fee received before July 4, 2026 may still qualify for incentives, even if adjustments are made later through change orders. This gives owners flexibility while locking in potential financial benefits.

Exploring Your Options in Residential Business Use

Every home and energy setup is different, but most scenarios fall into a few categories:

● NEM Expansion (e.g., 3-module add-ons)
Ideal for homeowners looking to expand an existing system without losing the cost savings from a grandfathered utility rate.

● Solar + battery combinations
Increasingly popular due to rising electricity rates and grid instability.

● Battery-only installations
A strong option for homes already equipped with solar.

Within each of these, eligibility and savings can vary due to several factors.

Here are some examples of common scenarios for comparison:

● Busine Use Percentage

● Availability of local rebates (like San Diego Community Power’s Battery Savings Program)

● Whether the system is designed for backup power vs. cost savings

Battery Systems: A Growing Trend

While the solar market has slowed, battery adoption is accelerating. Homeowners are prioritizing energy independence and protection against outages.

It’s also worth noting:

● A battery designed purely for cost savings can be $4,000–$6,000 less expensive than a full backup system.

● Battery installations are more complex, requiring more labor, which affects pricing and margins.

Market Reality: A Volatile Few Years

The solar industry has experienced major turbulence:

● Equipment prices have fluctuated due to tariffs, inflation, and supply chain disruptions

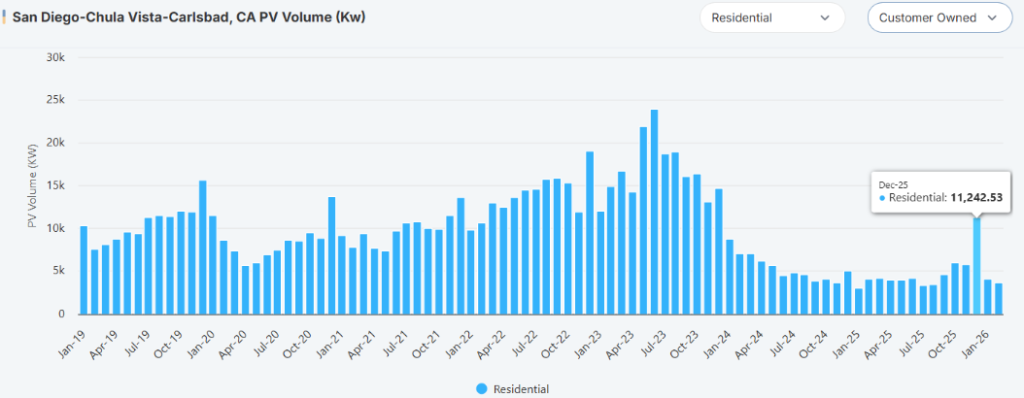
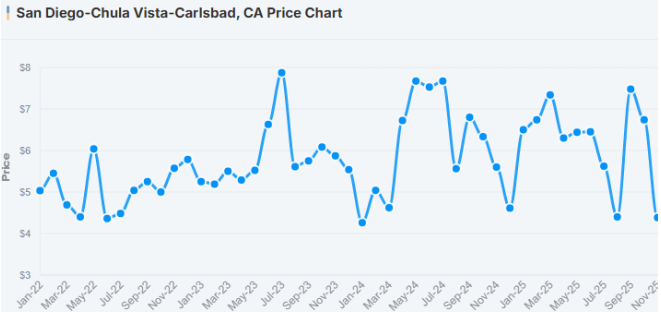
● The market saw a sharp contraction in 2024–2025, with many companies shrinking or exiting

● 2026 is shaping up to be one of the lowest-volume solar installation years in recent history

Credit: Ohm Analytics dashboard marketplace

At the same time:

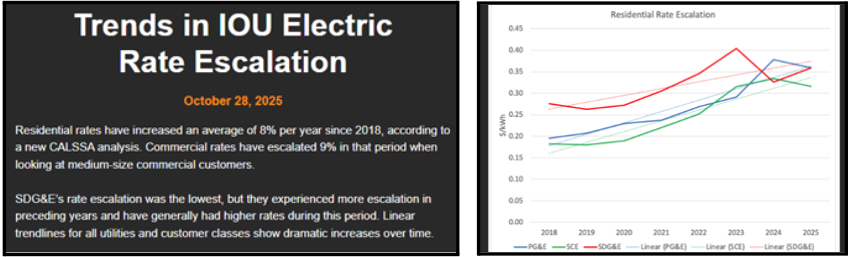
● Electricity rates have increased ~8% annually since 2018, doubling roughly every 7–9 years depending on rate structures

● The average solar PV cost/watt in 2025 ranged from $4.50 to $7.50 per watt, with regional averages around $6/watt, due to the 1kW CEC-AC add-on NEM Expansion limit.

Credit: CALSSA member newsletter. Click to become a CALSSA Member
Credit: Ohm Analytics dashboard marketplace

What This Means for You

Despite market uncertainty, the fundamentals still favor energy investment:

● Utility rates continue to rise steadily and SDG&E is already the highest cost utility power in the U.S., at $0.91/kWh Peak Rate (EV-TOU).

● Battery adoption is increasing due to real-world reliability needs

● Incentives still exist—but are now more nuanced and tied to usage type

The key question is no longer just “Should I go solar?” but rather:
“How can I structure my system to maximize savings under current rules?”

Final Thoughts

2026 isn’t the easiest year to navigate solar decisions—but it may be one of the most strategic.

If you’re considering solar or battery:

● Evaluate whether any portion qualifies as business use

● Understand your rate plan and energy consumption patterns

● Act before key deadlines to preserve eligibility

The opportunity hasn’t disappeared—it’s just become more tailored.

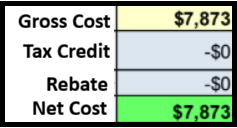
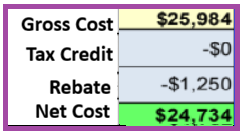
There’s a variety of options available for Residential Business Use NEM Expansion, for existing solar. Green Energy EPC by Makello, Inc has many hundreds of Current Customers with Net Energy Metering registrations that are eligible for an Alumni Discount. Click on the option that best matches your add-on Solar Only, Solar-Battery, or Battery Only NEM Expansion cost summary, to see a contract that is available for you to fill out, sign and return by May 1, 2027. Of course, Makello.com will be glad to help you through the process.

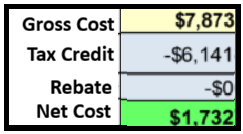
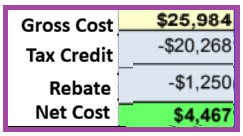
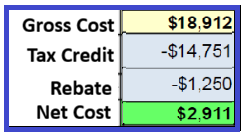
Solar Only Solar & BatteryBattery Only
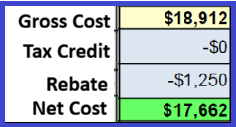
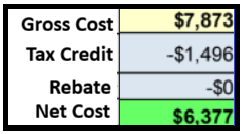
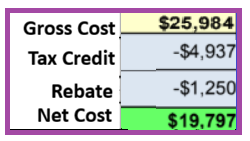
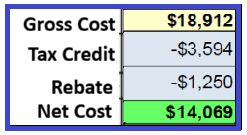
0% Business Use
25 % Business Use
100 % Business Use

Remember you have until 2030 to build. You only need to pay a minimum of 5% before July 4, 2026 to Reserve your Solar Tax Credit and Depreciation incentives!

How Do You Download Your 15 Minute Interval Data?


You are working a solar company and they have a lot of questions to determine the optimal system size that best matches your energy goals. Now you’ve been asked to download your SDGE Energy Usage data. There’s Green Button Data, Utility API Authorization, Two-Factor Verification or any other number of options. What do you need to do and how do you do it?

At Makello, we request either downloading Green Button data in 15 minute intervals from your SDGE account or to authorize Utility API collection of data on your behalf and this article will focus on those methods.

SDGE My Energy Center Login

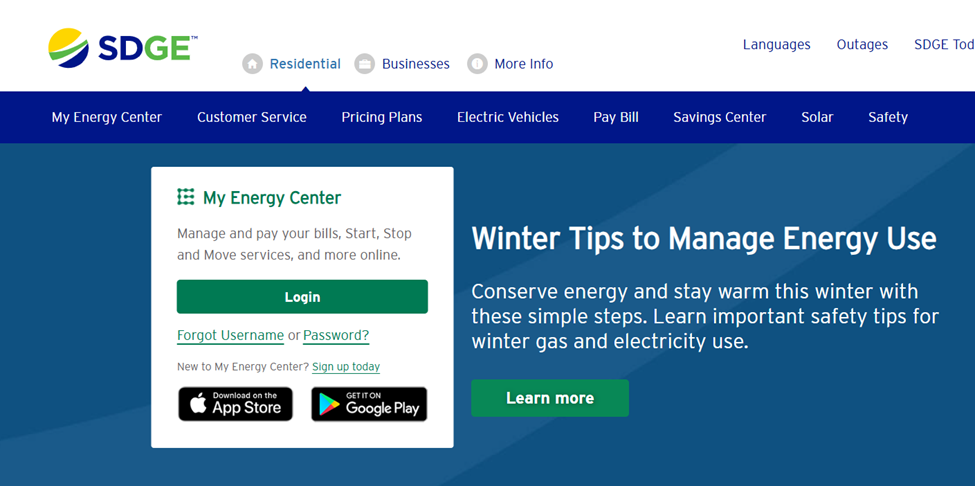
The first step to downloading your interval data from SDGE My Energy Center is to navigate to https://www.sdge.com/

Click on Login in the home page if you have already set up an online account to view your SDGE bills. First Time Users of SDGE My Energy Center should click on Set Up Today and follow the steps to register. You may have to login after registration. If you have two factor authentication activated, you will be asked to enter in a code that is sent to the email or phone number you have on file.

Green Button Data Download

After successful log in, you will see your dashboard. The dashboard design may vary due to your enrollment in a Community Choice Aggregator or not.

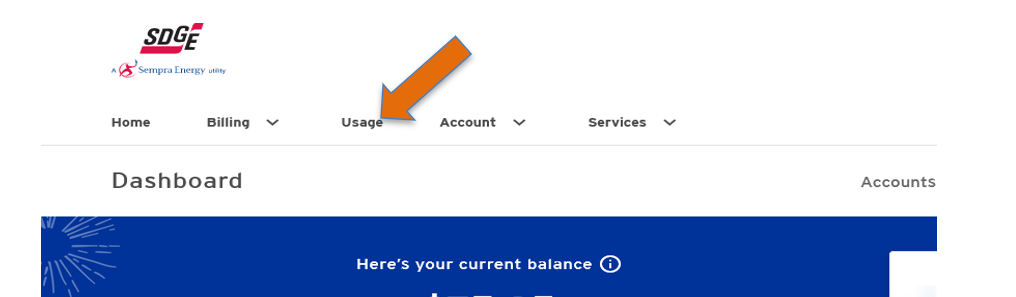
Click on the Usage tab at the top of the dashboard.

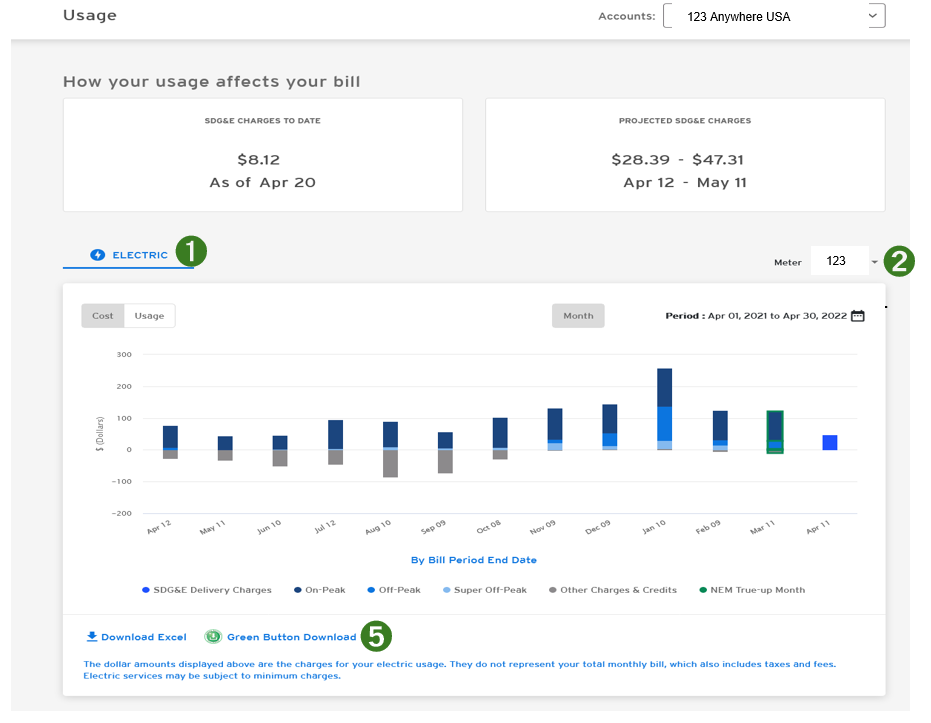
You can download your data from your Usage page.
1. Select Usage from the drop down menu in the Usage Tab.
2. Select your electric Meter from the drop down menu on the right side of the page.
3. Scroll down to the bottom of the page.
4. In the bottom left corner, you will see button for Download Excel and Green Button Download.
5. Click on Green Button Download to download data.  

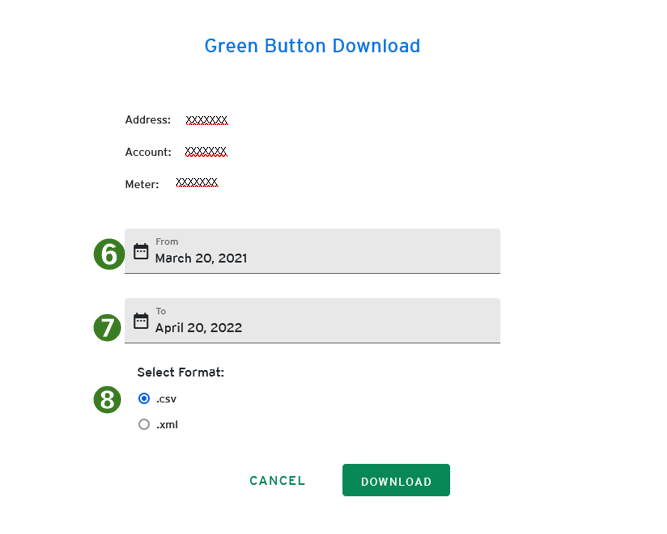
6. Set the date in the drop-down tab to download as many months of data as possible. Twelve (12) full months of data is preferred but one month of usage data is needed if  available.  
7. Under the Select Format heading, click .csv button (this step applies to electric meters only), then click download.
8. Under the Select Format heading, click .xml button, then click download (this step applies to both gas and electric meters for customers with both types of meters).
9. Repeat steps 1-8 for each meter that services the property, gas and electric.


Turning SDGE Two Step Verification Off or On

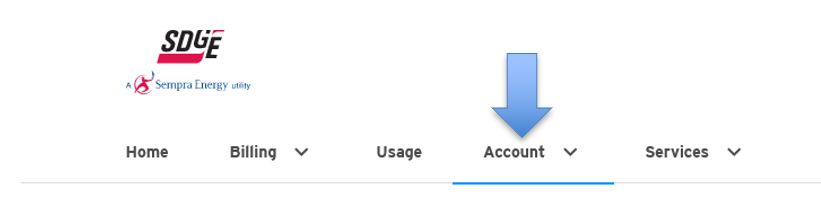
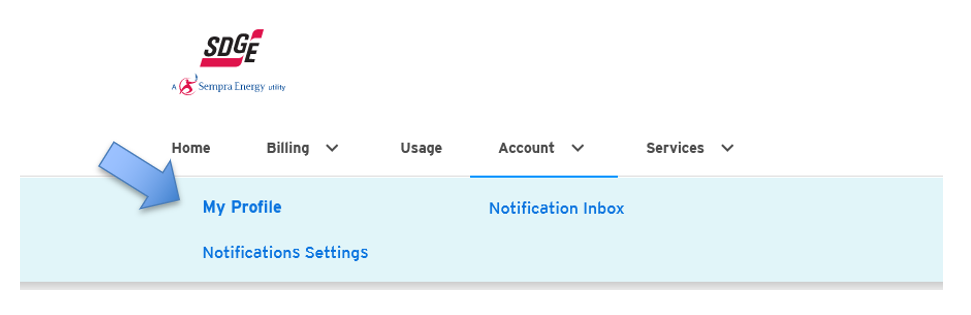
Turn 2 Step Verification off or on by clicking on Account in menu bar.

Then select My Profile from the drop down menu.

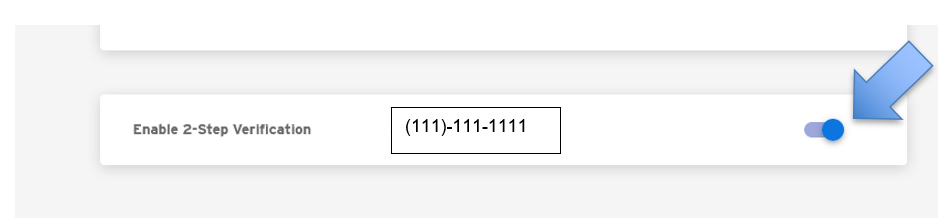
Scroll to the Enable 2-Step Verification section and click on the blue button on the right side of the screen to turn off the 2 Step Verification.

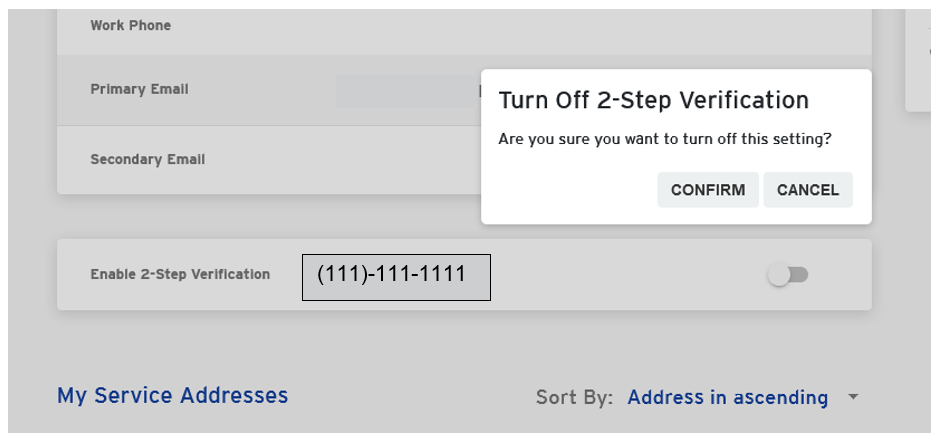
Click on Confirm in the pop up menu.

You have turned off the 2 Step Verification. Please note: 2 Step Verification must be completed prior to authorizing Utility API data collection.

To Turn 2 Step Verification back on, simply return to your Account, select My Profile, scroll down to Enable 2-Step Verification and click on the grey button on the right side of the screen, click on Confirm.  

Authorization of Utility API Data Request via Link


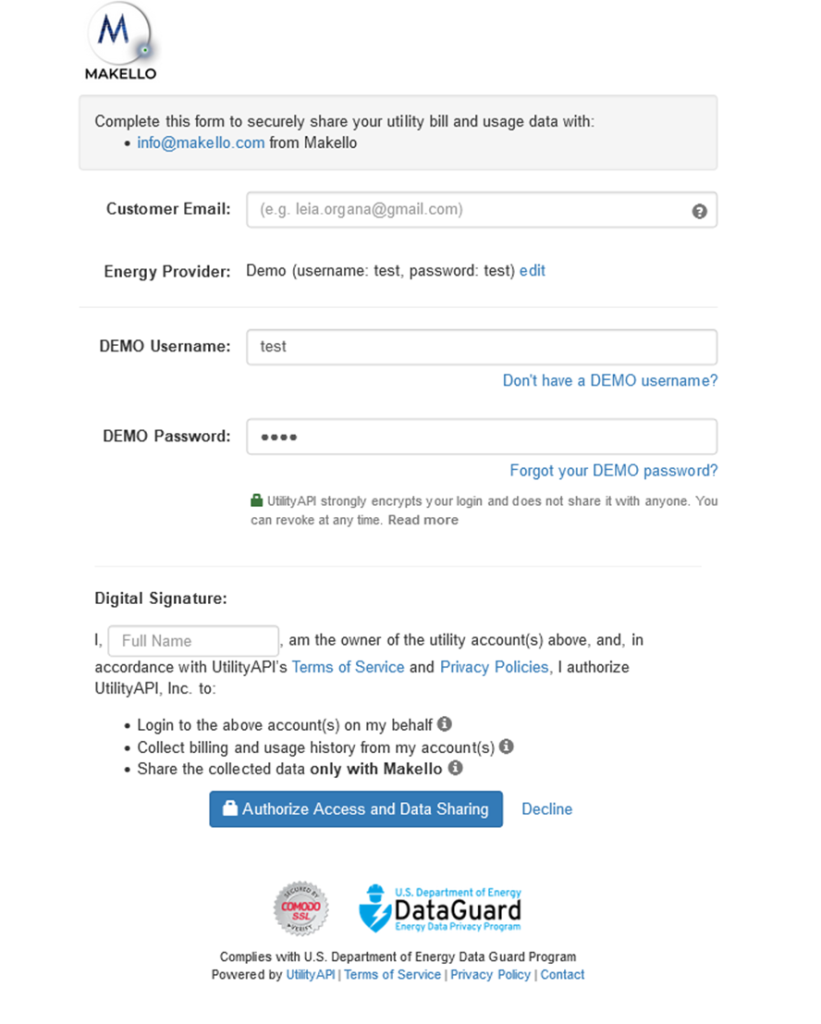
Please click on the Utility API Authorization link provided by Makello in the email you received.

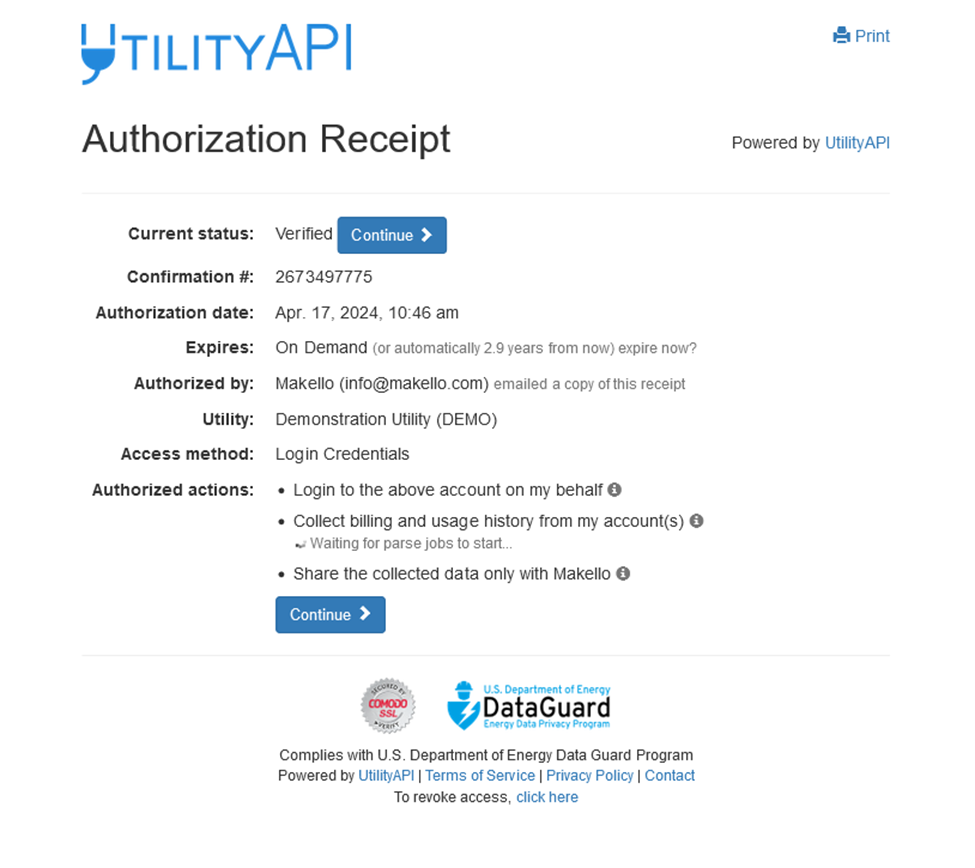
You should be brought to a screen similar to the picture below. Please provide the requested information and click Authorize Access and Data Sharing.

You should receive an authorization receipt similar to the picture below after authorization has been completed.

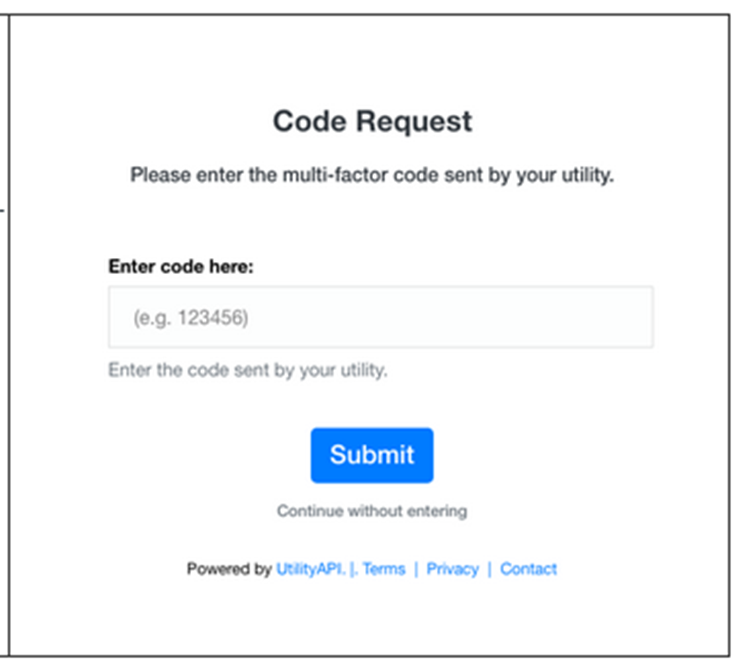
If your SDGE account has  two-step verification, you should then receive a two-step verification code from SDGE sent via text message.  Please enter the code in the space provided.  An example of  the screen  where you enter the two-step verification code provided in the image below.

Alternatively, you may manually deactivate and reactivate the multi-step verification for your SDGE by following the steps previously outlined.

Please note: 2 Step Verification must be completed prior to authorizing Utility API data collection.

Utility API Data Collection Refresh Historical Data

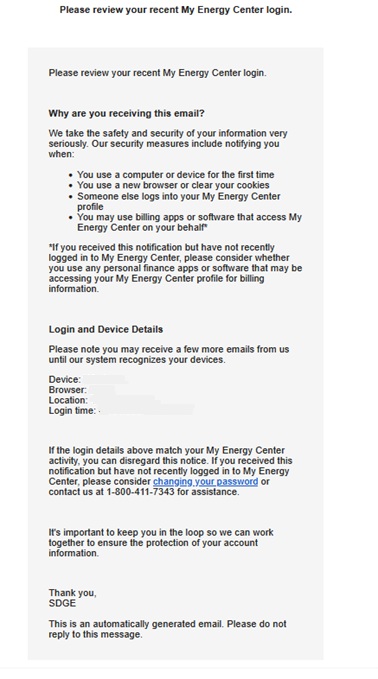
When Utility API Refreshes Data via a new collection, you may receive a message informing you of the activity on your account.

You may find out more about Utility API https://utilityapi.com/

SDGE Utility Bill Download Instructions

Next document needed is a .pdf copy of your bills

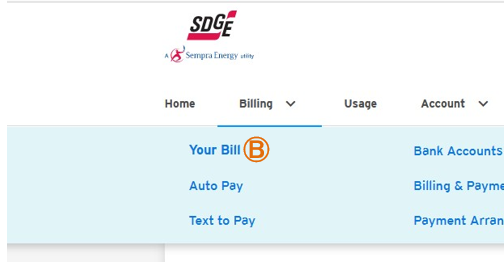
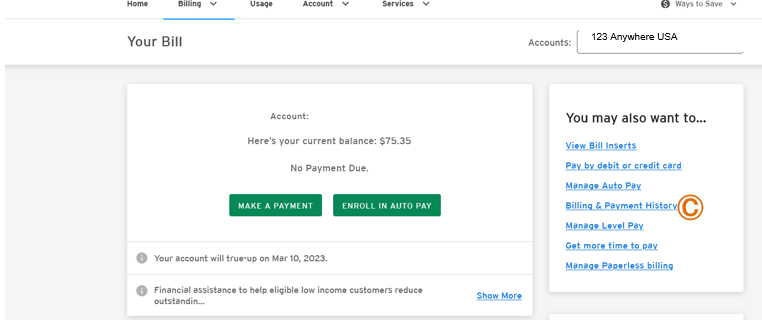
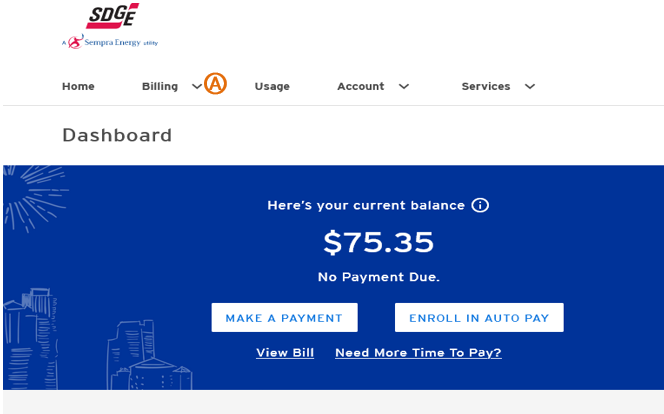
A. Click on Billing drop down menu at the top right of your dashboard.

B. Click on Your Bill from the Billing drop down menu.

C. Click on the link for Billing & Payment History from the menu on the right side  of the menu.

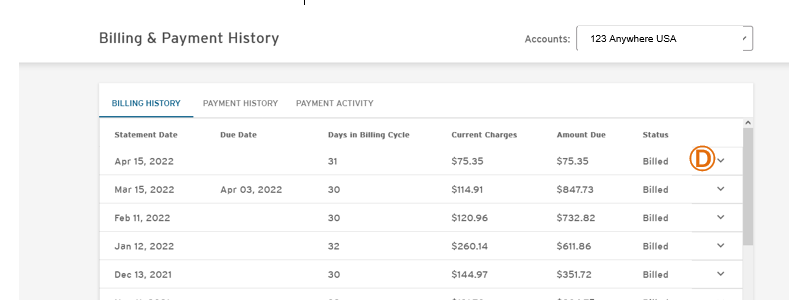
D. Click on the drop down menu arrow on the right side of the screen to display your bill.

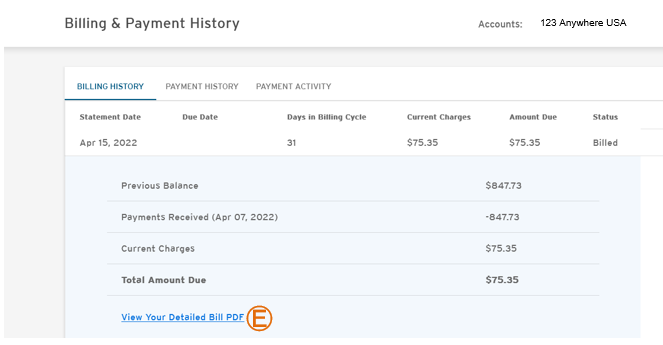
E. Click on the View Your Bill PDF link.

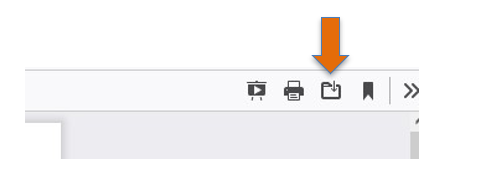
F. Click on the folder icon on your computer’s menu bar to download the file. Save the .pdf file to the folder of your choice.

G. Return to the Billing & Payment History Screen and repeat the download process detailed in steps D-F for as many of the most recent months of Bills available, up to twelve (12) months of Bills.

    Green Energy EPC by Makello CA Lic # 1110498

San Diego Residential Solar: Just How Worthwhile Is It?

Makello determine fastest payback and lowest cost for solar.

The value homeowners realize from having solar panels installed varies from state to state in the U.S. This value is most often measured as a solar payback or investment return. The solar payback period refers to the length of time it takes to realize enough electricity savings from a solar system to pay for the cost of installing it. The shorter the payback period, the greater the return on investment.

https://www.youtube.com/watch?v=UsTqvgC_xaI&list=PLrHVPFynJo112gIIoavaCwlnz6n-2Z6Z0
Get on the road to Energy Independence!

Book a FREE 15 minute appointment to: 1) Find out how Makello can help you. 2) Discuss your energy needs. 3) Get a FREE Energy Savings Estimate.

Makello determine fastest payback and lowest cost for solar.
Any size solar array reduces the electric bill and provides access to discount utility rates. Makello’s Optimal Cost Savings determines the fastest payback and lowest upfront cost for the site characteristics and owner goals.

What is the typical payback period for residential solar installations in San Diego?

To determine a typical payback period and return on investment for a residential solar installation in San Diego two factors must be considered: 1) the cost of installing the solar panels; 2) the revenue earned by the solar system. The costs are typically easy to determine. A solar company will usually quote one fee that includes the cost of the solar panels and all approvals, permits and inspections for the authority of jurisdiction and SDG&E.

The revenue produced by a solar system is a function of the amount of energy it produces each year compared to what would have been paid to the utility if the same amount of energy had been purchased from the utility without the installation of solar panels.

Book an appointment to receive Makello’s Ethical Energy Savings Report, which is the result of a detailed trade-off study of discount utility rates, grants, rebates, tax credits, and equipment options, to determine the fastest payback and highest return on investment to meet your home, business and vehicle energy needs.

The fee for the Ethical Energy Savings Report is refundable (less the 3rd-Party $15 utility data access charge) or credited towards our installation services, after you attend the presentation meeting and complete a 5 minute survey after permission to operate.

Includes up to 5 hours research by the Makello team, and 1 hour Q&A, by Makello’s Ethical Energy Efficiency Expert.

Fundamentally, the amount of solar energy a residential PV system produces depends on weather conditions and climate. And most importantly, the amount of sunshine (the incident solar radiation or solar insolation in a given location). No surprises here that Southern California hits it out of the park on energy generation from solar panels. You can go weeks without seeing a cloud in San Diego. Electricity generation of up to 1,650 kWh per year per 1 kW of peak DC solar panels installed makes San Diego a very attractive location for solar panels.

Air flow can cool modules and increase annual production.
Open air flow under carports can cool the modules and increase annual production. Beware of solar companies that tout extra short roof jacks and stylish tapered bumper edges that restrict airflow, causing overheating and reduced production.

Moving down to the bottom line, the financial incentives available for residential solar energy systems can make or break an investment decision. These vary widely across the US. In California, the most important incentives are the 26% federal solar tax credit and the NEM 2 net metering law passed by the California PUC. If we run numbers for a typical household, in San Diego, with a $250 per month SDG&E electric bill, through the “solar panels cost and savings calculator” we see the recent average cost of installed solar systems in San Diego and SDG&E electric rates, for all site location types, including clay tile, flat roof and ground mount systems that are more costly.

To what extent do high SDG&E electricity rates contribute to return on investment for solar users in San Diego?

San Diego topped a ranking of installed solar energy capacity and ranked second in installed solar energy capacity per capita in major US cities, according to a report from the California Environment Research & Policy Center. In so doing, San Diego surpassed Los Angeles, the previous first place holder, and trailed only Honolulu, Hawaii in the per capita ranking.

Let’s dig a little deeper and look at whether it’s actually worthwhile for a San Diego resident to invest in a solar PV system. To do so, we’ll make use of residential solar information resources of utility energy costs in major cities and metro areas across the country. To zoom in on the likely cost of actually having a residential PV system installed in San Diego, we’ll also make use of our tried and true, local guide to solar installation companies and residential solar cost calculator.

What we note from this is that SDG&E, the electric utility serving San Diego, has some of the highest electric rates in the nation. This, along with the exceptional amount of sunshine in Southern California, is why San Diego has the shortest payback times in the nation (and therefore the highest return on investment) for residential solar panels in California.

What incentives are available, in San Diego, to help with the cost of installing solar panels?

There are a variety of residential solar incentives available across the US. As the Solar Energy Industries Association explains: “Effective direct incentives can take a variety of forms depending on the particular situation and administrative abilities of a given state. Some states have chosen to offer tax credits, others to offer up-front rebates administered by state agencies or utilities, and still others offer performance-based incentives that are paid by an agency or utility over time based on kilowatt-hour production.”

Are you ready to save money on solar power, EV charging or Energy Storage? Get an instant quote from Makello!

Sorting through all these incentive programs, much less doing all the paperwork required to qualify for them, can be daunting. In all likelihood, you will be able to find and work with a solar finance/installation company that will assume much of the bureaucratic burden. Make it a point to include this on your checklist when shopping for the right provider.

Up to 100% subsidies are available for solar installations.
For certain Low-Income qualified homes, it may be possible to have a solar system installed for free, through subsidies. Makello will tell you if you qualify, even if it means there is no sale opportunity. That is one of the ways we contribute to making solar accessible to everyone!

California continues to be a nationwide, and worldwide, leader when it comes to solar and “green” energy policies and programs. The most important incentive, by far, is the 26% federal solar tax credit and the NEM 2 net metering law that gives you almost full retail value for excess solar power exported into the grid during the day.

How much does San Diego’s high degree of sunshine contribute to the attractiveness of solar there?

Although we have touched on this topic, measuring the amount of solar energy a residential PV system is likely to generate over any given period of time is not as simple or straightforward as it might appear at first glance. It’s important to be sure you’re comparing apples to apples here.

By scientific convention, the amount of solar radiation available per unit area in a specific location is measured in kilowatt-hours per square foot per day, or for those more physics-minded, in megajoules per square meter per year. Other variables come into play, such as whether or not “direct” radiation, aka “direct-beam” radiation, or “diffuse” radiation is being measured. The former, as the term suggests, only measures the light that hits the earth’s surface directly, not any scattered or reflected sunlight. Diffuse radiation is a measurement of scattered sunlight while “albedo” radiation measures light reflected by the earth’s surface. As we have seen, 1 kW DC of solar panels installed in San Diego produces up to 1,650 kWh of energy per year. In comparison, many places in the north-east of America produce around 1,200 kWh per year. Using these numbers, San Diego produces up to 37% more power than the same panels would if they were installed in the north-east. This is a major contributor to making San Diego one of the most profitable cities in America for utilization of solar panels.

Makello position solar panels to maximize energy production.
In San Diego, peak annual solar production is achieved by optimal orientation (180 degree south at 32.5 degree tilt), no near object and low horizon shading, with excellent air-flow underneath the modules and frequent module washing. Summer peak production is 17 degree tilt at 180 degrees south. Winter peak production is 47 degree tilt at 180 degrees south. If your south facing roof is shaded, Makello can install on the north roof with reverse tilt to the south. East tilt is 12% less than south and west facing tilt is 10% less than south.
Makello makes driving easy as 123
Makello Makes Driving Electric as Easy as 1-2-3
utility black out battery back up power
Where Will You Be In The Next Blackout?
battery backup power 2020
Get On The Road To Energy Independence!