Equity, Electric Vehicle Sales and Public Charging Stations

Map showing the distribution of public electric vehicle charging stations in San Diego County

What comes to mind when you think of the average electric vehicle owner? Where do they live and what is their economic status? These are excellent questions to ask when assessing where to build EV charging infrastructure, but are impressions correct and rooted in reality? Are community resources being distributed equitably or are misconceptions leaving communities under served?

Makello decided to look at the data. We downloaded the City of San Diego 2019 Climate Equity Report, California Energy Commission 2020 ZEV and Infrastructure Stats for Vehicle Population, and the US Dept. of Energy Alternative Fuels Data Center CSV Alternative Fuels Data Center: Alternative Fueling Station Locator data, and we used the data to create some maps.

First, we reviewed the Median Household Income data from the City of San Diego 2019 Climate Equity Report to get an idea about income levels of residents within the City. The City of San Diego 2019 Climate Equity Report used the Census Tract as the smallest area to determine report indicators. The vehicle sales data uses zip codes as the unit for determining area of sales so we have overlaid the zip code outline over the map of Census Tract Median Income data for easier comparison. 

Median household income as reported in the San Diego 2019 Climate Equity Report. Median Household Income data reported by US Census Block with an outline of zip codes overlaid data. Click on map to view larger in another window.

Are there unexpected communities purchasing EV and PHEV vehicles? We sorted the 2020 vehicle sales data by fuel type to select the Battery Electric Vehicle (EV) and Plug in Hybrid Electric Vehicle (PHEV) sales and joined the resulting tables with the zip code shapefile downloaded from the SanDAG Data Warehouse. This enabled us to show the 2020 vehicle sales by zip code on a map. The map of median income was then compared to EV and PHEV sales. Starting with EV sales, we looked at four zip codes with census tracts identified as higher income areas and four zip codes in an area identified in the San Diego 2019 Climate Equity Report as communities with less access to opportunities.  Those zip codes are 92037, 92102, 92105, 92113, 9211, 92127, 92129, 92130.

Find out how much you can save with Electric Vehicles and discount utility rates.

This map is showing the zip codes chosen for comparison, 92037, 92102, 92105, 92113, 9211, 92127, 92129, 92130, including zip codes in Chollas Creek, Logan Heights, La Jolla, Carmel Valley, Rancho Penasquitos, Black Mountain Ranch, Encanto, City Heights, Barrio Logan. Click on map to view larger in another window.

Now that we have determined which areas we wished to compare, we created a map by sorting the 2020 vehicle sales data by fuel type to select the Battery Electric Vehicle (EV) and Plug in Hybrid Electric Vehicle (PHEV) sales and joined the resulting tables with the zip code shapefile downloaded from the SanDAG Data Warehouse. This enabled us to show the 2020 EV vehicle sales by zip code on a map as indicated by the symbol showing the number of vehicles sold  shown here   

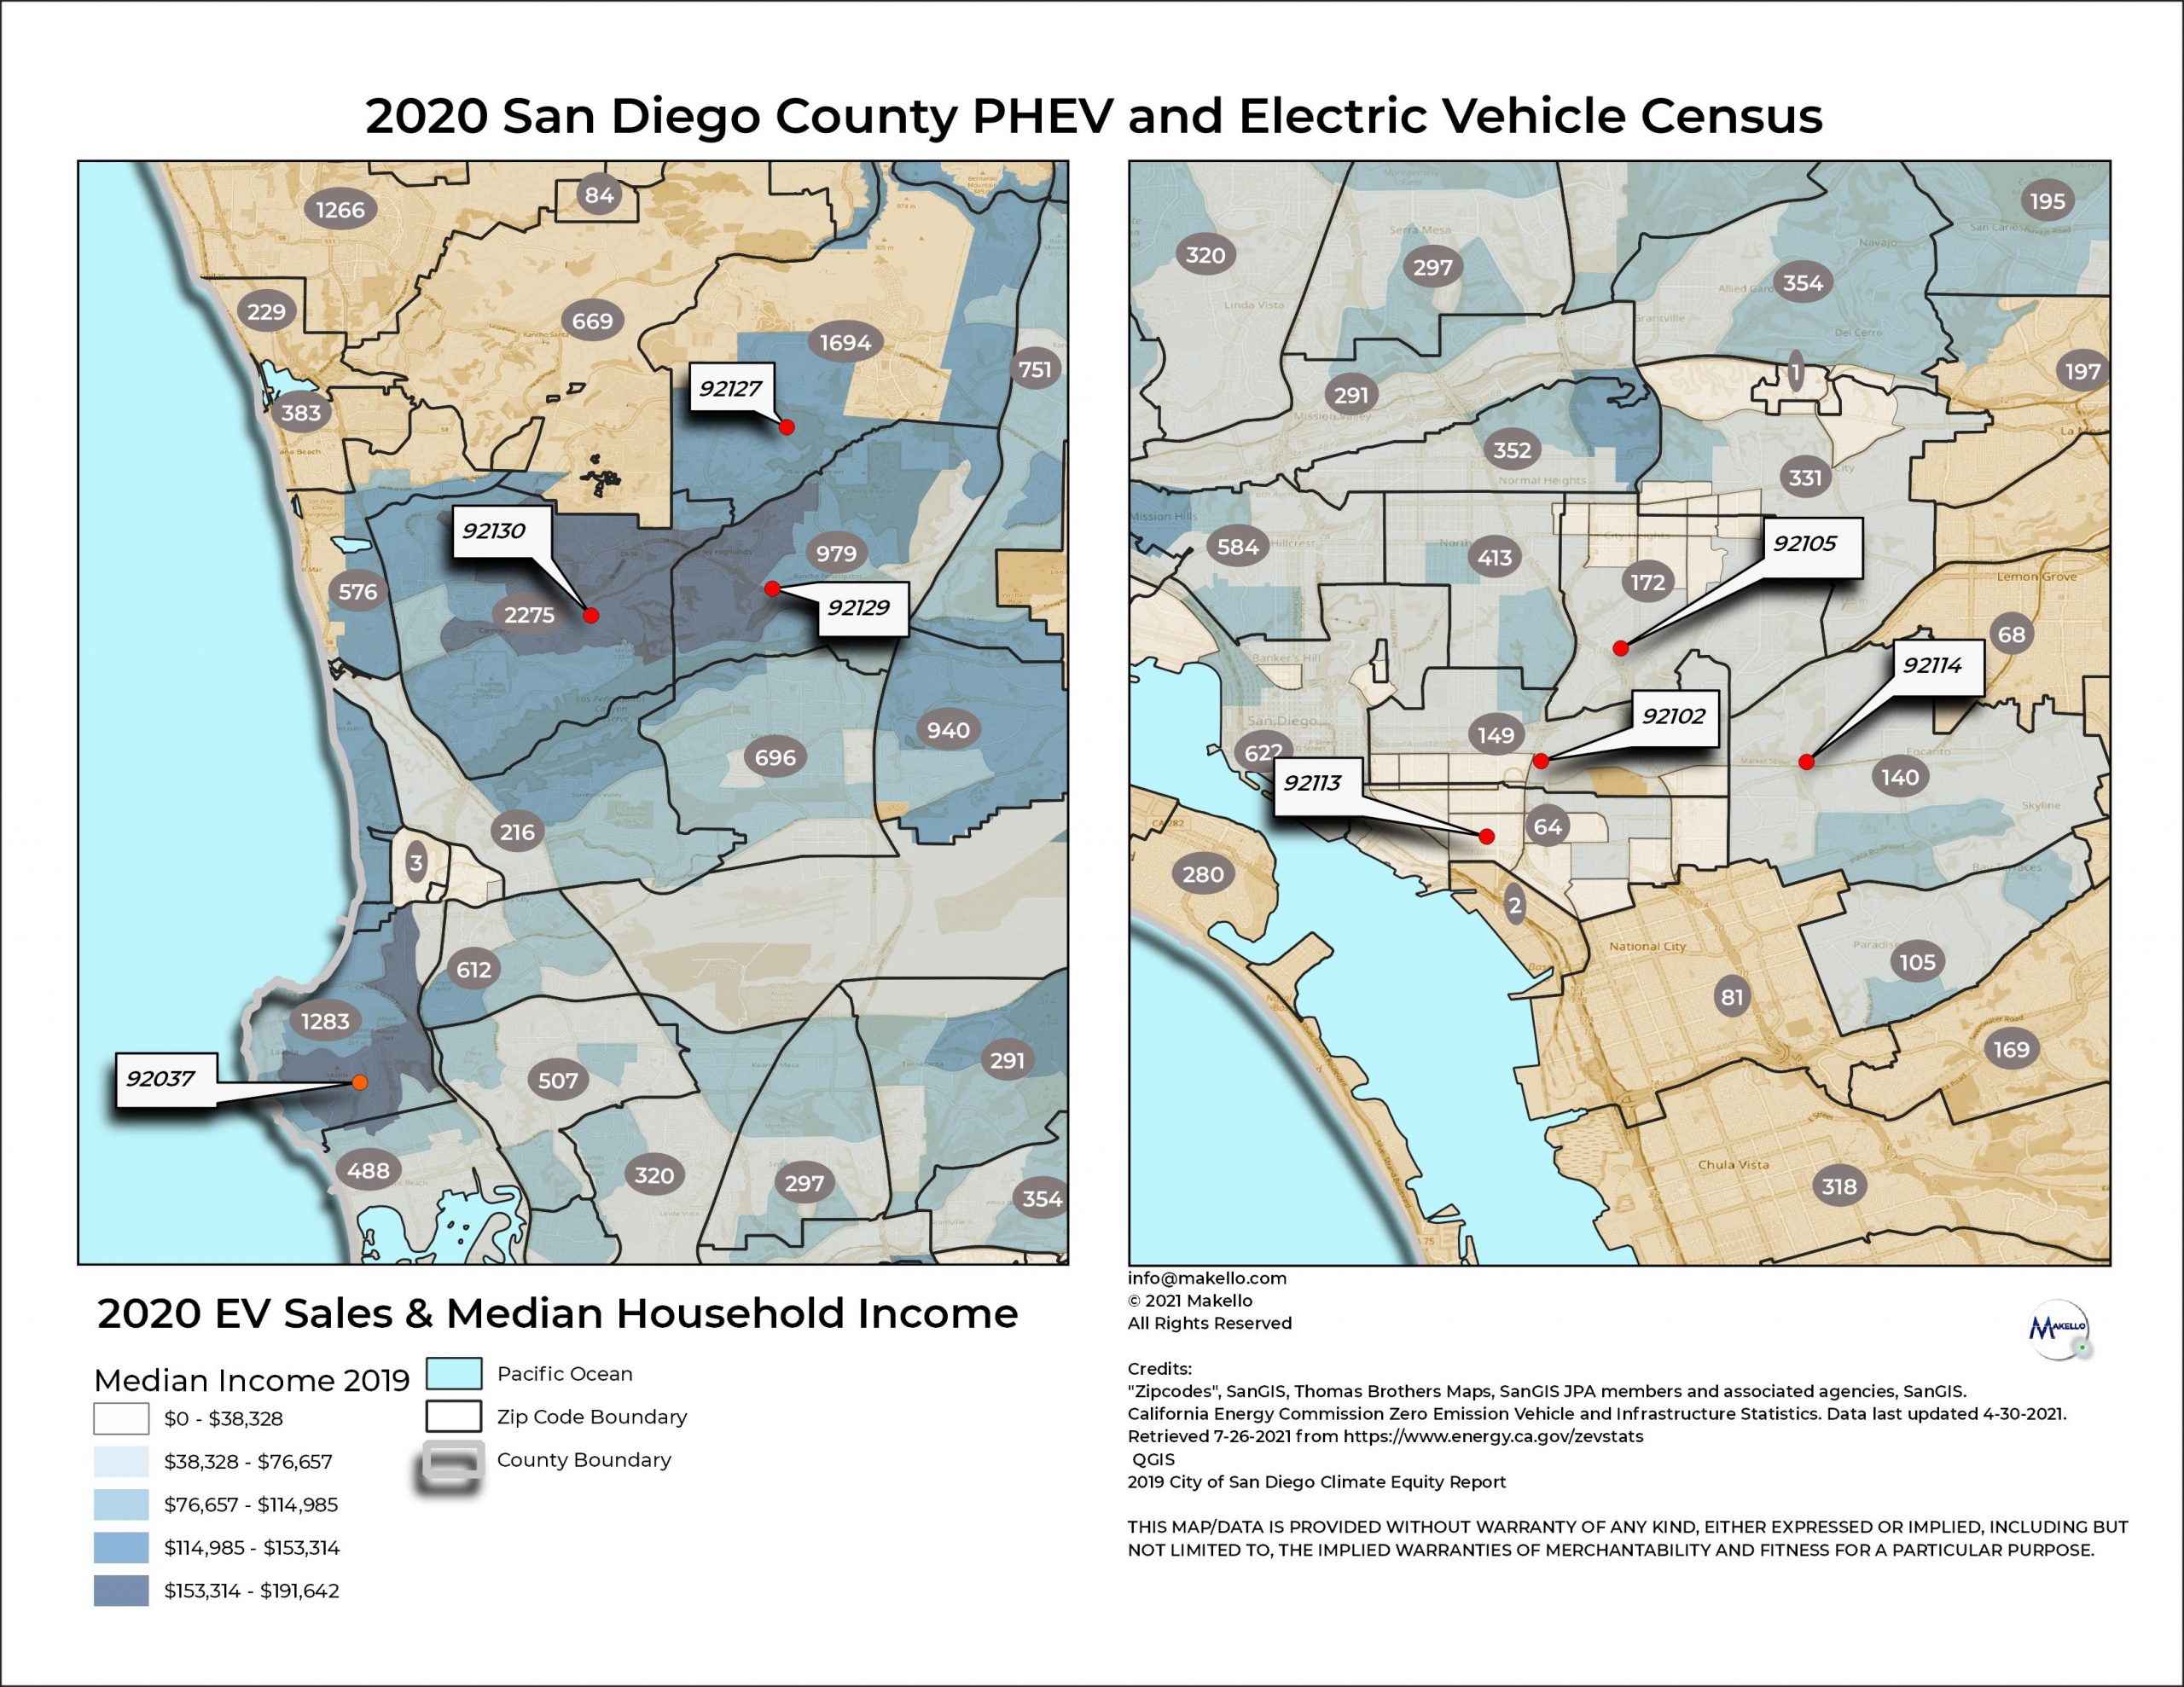
These two maps show a closer view of the median household income and the number of new battery electric vehicle (BEV, EV) sales in 2020. Click on map to view larger in another window.


As you can see from the map, the highest EV sales are in and around the neighborhoods with the top range for median income. The top three EV purchasers in San Diego County are living in 92130, 92129 and 92037 respectively. Surprisingly, and more interestingly, the zip codes we chose to look at that are in areas identified as having less access to equity in San Diego show residents in these areas are purchasing electric vehicles in fair quantities.

The other 3 zip codes near 92113 have double the EV sales with 92114 residents purchasing 140 EV, 92102 residents purchasing 149 EV and 92105 residents purchasing 172 EV. The median income for the nearby residents are overall in the next higher income bracket. This shows that as vehicles become available that are priced attractively to the residents in these neighborhoods, they will make the purchase. There is an interest in greener options and a willingness to adopt technology at the right price point and feature package.  

What about Plug-in Hybrid Electric Vehicle (PHEV) Sales? Makello mapped 2020 PHEV sales using the same procedure for 2020 EV Sales.

These two maps show a closer view of the median household income and the number of new plug-in electric hybrid vehicle (PHEV) sales in 2020.

The map indicates PHEV purchases are more level across the City but there is one very unexpected find. PHEV sales are half as many as the EV sales in the 92113 zip code. Plug-in Hybrid Electric Vehicles are generally considered to be the more affordable option but they do not seem to be as enticing as the full battery electric vehicles for the residents in the 92113 zip code. This is contrary to conventional wisdom especially considering 2020 was a Pandemic Year and large numbers of the population were facing additional income stressors.


The final question is how are the public charging stations distributed and how does the distribution compare to the vehicle purchases? Are communities under served? Makello created a map of the public charging stations using data downloaded from the US Dept. of Energy Fuel Stations locator map https://afdc.energy.gov/stations/#/find/nearest. Station data is imported daily directly from the networks of Blink, ChargePoint, Electrify America, EVgo, FLO, Greenlots, OpConnect, SemaConnect, and Webasto into the Station Locator.

Red markers showing the distribution of public electric vehicle charging stations and the zip codes chosen for comparison. Click on map to view larger in another window.

Generally, it is common for someone to think public charging stations are installed where people who purchase EV and PHEV vehicles live but this is not always the case. Types of housing such as single family housing or multi-family housing, housing density, commercial properties with retail and office space, and property owner interest are all additional factors that impact where public charging stations are installed. The Makello map shows there are several of the zip codes we chose to examine that do not have good access to public charging stations. It was surprising that there are gaps in access to public charging in the more affluent zip codes we examined. Below is a chart summarizing the statistics of the eight zip codes we examined.

Zip CodeMedian Income RangeEV- 2020 SalesPHEV- 2020 SalesPublic Chargers
92102$0- $114,9851491120
92105$0- $76,6571722121
92037$76,657- $191,642128350626
92113$0- $76,65764363
92114$38,328- $114,9851401191
92127$76,657- $153,31416945786
92129$38,328- $191,6429795331
92130$38,328- $191,642227580823
Table containing the zip code, information for each zip code including medium household income range, 2020 EV and PHEV new vehicle sales and public charging stations.

As you can see from the table, the residents in only one zip code we examined showed a preference for plug-in hybrid electric vehicle. Residents in all other zip codes preferred the battery electric vehicles. It is obvious from the chart that there are very few public chargers available compared to the number of vehicles in the zip codes. Presumably, the residents in these zip codes would like to be able to use a charger while they run errands around their neighborhood and have difficulty with the current number of available public charging stations.

Public Electric Charging Station distribution in San Diego County indicated by the red markers. Heat map showing the concentration of the public electric charging stations in San Diego County. Lighter colors in the heat map equal higher density of public electric charging stations. Click on map to view larger in another window.

The final map above that Makello created is a heat map to highlight the distribution of public charging stations county wide. All of the charging stations are located in the western part of the county in the urban areas. There aren’t any charging stations listed in the data we downloaded in remote fueling stations or recreation areas.

The map of the charging station locations shows the stations tend to be clumped in proximity to other charging stations. This may be due to one commercial property owner sees neighbors installing charging stations then they decide to install. The most concentrated collection of public charging stations are located in downtown San Diego and around UC San Diego. Clearly, there are many areas of San Diego County that do not have access to public charging in their neighborhoods.

The maps Makello created show there are gaps in access to public vehicle charging stations. That lack of access may present many residents with obstacles to adoption of sustainable technology but the lack of access to public charging stations is not stopping all residents from purchasing battery electric and plug-in hybrid electric vehicles. This indicates an interest in the technology and when the opportunity presents itself to purchase EV or PHEV vheicles, many residents are making the decision to make that purchase.

Commercial property owners should use data when making the decision whether or not to install a charging station on their property rather than rely on perceptions because as we have shown, perceptions that residents in one area or another are not purchasing EV and PHEV may run counter to “common sense”.

The Big Beautiful Bright Green Electric Bus

Makello supports community and non-profit organizations
In Chollas Creek, Makello supports community and non-profit organizations, such as Groundwork San Diego, with grant writing and presentations at events. Makello educates school staff, parents, and students about Plug-In Vehicles, Solar Power, and Energy Storage. Visit our grants page for updates about a multi-million dollar win for San Diego!

When people think of buses, many think of the stinky exhaust fumes. Fortunately, San Diego has an ambitious climate action plan that puts an emphasis on clean public transportation and MTS has been implementing changes in vehicle fuel types to improve the region’s air quality and lower costs. The latest step for MTS has been to test out several all electric buses on several routes.

I had the privilege of unknowingly stepping onto one of these new buses one day. I was waiting for the route 10 bus at Old Town on my way home from work. The first thing I noticed was there was a lot more head room in the bus. The bus felt very spacious. It was a nice change. The bus pulled out of the depot and it was so quiet. I couldn’t believe my ears. I was really curious. Was this bus an electric bus? I asked the driver and it was confirmed. I was surprised because I hadn’t heard about the roll out of the new vehicles. The ride was pleasant and didn’t have the normal exhaust smell. The bus had plenty of acceleration after each stop. According to MTS, the all electric buses are about 10 decibels quieter than the standard bus. I can tell you from experience, the difference is noticeable.

Book a FREE 15 minute appointment to: 1) Find out how Makello can help you. 2) Discuss your energy needs. 3) Get a FREE Energy Savings Estimate.

My next thought was to wonder what routes the buses were being tested on and if the first buses were being used in the Chollas Creek Watershed to help reduce pollution in that region of our County.  I found the planned routes listed in the MTS Zero Emission Bus Pilot Program Fact Sheet so I started to map bus routes and since children are particularly vulnerable to pollution, I included schools within 500 feet of bus routes. As you can see below, there are a lot of schools on bus routes.

Makello works, hosts events, and hires in Chollas Creek.

Click here to learn about Makello volunteering at EarthLab in Chollas Creek.

Click here to read about a Makello internship that was offered to an intern with Groundwork San Diego in Chollas Creek.

electric buses, schools, diesel particulate matter, transit
Many schools lie within 500 feet of transit routes, which could increase respiratory problems for people in those schools, especially students.

The top tier for diesel particulate matter are indicated in the Census tracts outlined in white and the second highest tier are the areas outlined in grey. The red indicates the portions of school parcels that are within 500 feet of the bus route. Clearly there are quite a few children impacted by particulate matter on a daily basis and clean fueled buses can be of great benefit to these neighborhoods. 

electric buses, schools, diesel particulate matter, transit
We can see the electric bus transit route is serving an area with a high percentile of diesel particulate matter. Hopefully this will help combat health issues from driving pollutants.

But where do the routes in the MTS Zero Emission Bus Pilot Program announcement run? I was quite happy with the results when I mapped the data MTS provided in the announcement. The pilot program was scheduled to debut in the areas most impacted by particulate matter pollution. For more information on the health impacts of pollution in this community, please read Makello blog African Americans Concentrated in Diverse Redlined San Diego. 

Makello works with non profits and other agencies to create maps for Environmental Justice initiatives.

Hopefully you get to experience the new buses. Keep an eye out for them. They are a really bright green color. You would think the color would have clued me in before I ever stepped on the bus but I’m so used to bus wraps I was a little slow catching on. Hopefully, the program is a lot quicker to catch on and San Diegans can reap the benefits of noise and pollution reduction. 

References

https://www.sdmts.com/sites/default/files/attachments/2019.10.17_zeb_fact_sheet_final.pdf

Our Mission, Vision and Purpose, Since 2010

Extreme competition in the solar industry and falling prices has resulted in poor quality workmanship, electrical problems, roof leaks, gimmicks, and unethical behavior.  Who can you trust to upgrade your most valuable asset, your home?

Book a FREE 15 minute appointment to: 1) Find out how Makello can help you. 2) Discuss your energy needs. 3) Get a FREE Energy Savings Estimate.

Makello aims to fix the broken solar industry with a full-disclosure report by an Ethical Energy Efficiency Expert, and documentation of the highest quality workmanship and components, to protect the budget and the home warranty.

Makello’s Mission is to tackle climate change by delivering clean energy solutions to improve social and environmental justice. 

Why?  Because Disadvantaged Communities, often located downstream and downwind of pollution, are extremely costly to rebuild after increasingly frequent weather disasters, and are impractical to relocate to escape sea level rise.

Makello Team City Heights 5k run
The Makello Team (left to right) Agustin, Ola, Linda, Charlie

Makello’s Vision is for you to join the Energy Ecosystem in a way that fits your life.  We can help you use incentive programs to afford a Plug-In Vehicle and Solar Power to charge your car and your home, and we can help you create a back-up clean Energy Storage system for emergencies.

Makello CEO Charlie Johnson
CEO and founder of Makello, Charlie Quux Johnson, receiving a North County Climate Change Alliance award at the NCCCA’s “EV Show Kicks Gas”

The choice is yours. Make your energy costs and emissions low with Makello, to get “On the Road to Energy Independence!”

Public Electric Vehicle Charging Station Access Inequity
Public access to EV Charging Stations is unevenly distributed. Makello’s mapping can show the inequity that may inhibit green technology adoption in some communities.

If you caIf you can’t find a conveniently located public EV Charger, then click on “Request A Public EV Charger” to suggest a location for future consideration, to be built with up to 100% Federal and State of California incentives.

Makello works with non profits, such as the CSE, North County Climate Change Alliance, SD 350 and Groundwork San Diego other entities to create maps for Environmental Justice initiatives.

To learn more about Makello, click on the videos below.

utility black out battery back up power
Where Will You Be In The Next Blackout?
battery backup power 2020
Get On The Road To Energy Independence!
Makello makes driving easy as 123
Makello Makes Driving Electric as Easy as 1-2-3

African Americans Concentrated in Diverse Redlined San Diego

1930s redlining impacts African American communities today.

Makello is developing GIS services and creating maps useful to the solar power, electric vehicle, and energy storage industries, as well as for our teaming companies, including several non-profit organizations.  Maps are an important method for analyzing and presenting data.

We will examine redlining and clean-air technology access by the San Diego African American community in this blog. See the editor’s note below on how we will be using the Census Bureau term African American as defined by the Census Bureau: Race for Residents of African ancestry or birth including both US Citizens and non-US Citizens. For more info on data sources and terminology, references are provided at the end of this article.

Makello works with non profits and other agencies to create maps for Environmental Justice initiatives.

Editors Note: Click to view Makello’s commitment to finding words and methods to accurately represent data while conveying inclusion of the appropriate demographic.

Makello began using maps to analyze data and learn about our community in 2019. From time to time, we intend to share some of the maps we’ve developed but there are challenges to presenting the data accurately and transparently, especially with regards to designations for Race, Identity and Ethnicity.

The US Census counts all people living within the Boundaries of the United States and Territories. The data collected is by Race, not citizenship status. The Census data uses terminology that can easily be misunderstood because of common usage of terms vs. the Census Bureau definition. The Census Bureau meaning of the term is often lost as the data filters down to the public through agencies and businesses.

The Census Bureau uses the terms African American, Asian American, Native American, Hispanic, White and Other to define Race. Citizenship or immigration status is not counted. The loss of context of these words may prevent accurate and full understanding of data. People may feel invisible or may be unintentionally misled.

You may have noted a few potential difficulties in the short list of the terms presented. That is where the struggle lies when attempting to represent residents without being US-Centric or Ethno-centric. Acceptable terminology changes through time, is understood differently in separate regions and countries, by different cultures and ethnicities. Individuals infuse meaning in words based on their life experiences, making classifications difficult.

Maps may focus on a specific demographic for any number of reasons. It can be difficult to adequately portray diversity on the map with charts or graphs. Please refer to the two examples below.

map data representation graphic

Makello is committed to the difficult task of finding words and methods to accurately represent data while conveying inclusion of the appropriate demographic. We make great effort to research and vet language. Language and identities change. Unfortunately, there is no all encompassing, perfect language for describing people. What one person thinks is a great label and strongly identifies with, the next person may reject or find offensive. We accept open and honest feedback and hope you enjoy the information we present.

Afircan Americans mostly in southwest San Diego.
African Americans in San Diego are concentrated in southwestern San Diego County.

The first question to answer is where are the communities with 10% or more of the African American residents? A map of the demographic data from the CalEnviroscreen 3.0 is the simplest method of discovery. CalEnviroscreen obtained demographic data from the US Census Bureau and retained the US Census Bureau demographic descriptors in their report. Our map above shows the population is largely concentrated in the area to the east of Downtown San Diego which will be the area we focus on for the purpose of this blog. 

Why is the population so heavily concentrated in this area?  With a special thanks to University of Richmond’s Digital Scholarship Lab, a look at the 1930s New Deal Era Home Owners’ Loan Corporation Redline Maps may help to answer this question.

The Home Owners’ Loan Corporation (H.O.L.C.) was created during the Great Depression New Deal Era and the program trained many home appraisers in the 1930s. The H.O.L.C. created a neighborhood ranking system known today as redlining. Grades were assigned to residential neighborhoods by local real estate developers and appraisers in over 200 cities. These maps and neighborhood ratings set the rules for decades of real estate practices. The grades ranged from A to D.

The Green Area- Grade A = Best: Always upper-middle-class to upper class White neighborhoods defined as posing minimal risk for banks and other mortgage lenders, as they were “ethnically homogeneous” and had room to be further developed.

The Blue Area- Grade B= Still Desirable:  Neighborhoods with all or mostly White, U.S. born residents were defined as sound investments for mortgage lenders.

The Yellow Area- Grade C =Declining: Residential neighborhoods with working class and/or first or second generation immigrants from Europe. The housing stock was typically older and often lacking the current utilities of the day. 

The Red Area- Grade D= Hazardous: These neighborhoods were considered to be “infiltrated” with “undesirable populations” such as Jewish, Asian, Mexican, and Black families. The neighborhoods were more likely to be located near industrial areas and the housing stock consisted of older, less well maintained buildings.

Are you ready to save money on solar power, EV charging or Energy Storage? Get an instant quote from Makello!

These grades formed the basis for federally backed mortgages. Many banks refused to lend to areas with the lowest grade, making it impossible for people in these neighborhoods to become homeowners and preventing them from building generational wealth.

As you can see from the map, many of the areas that were labeled undesirable  in the 1930s are still the areas where African Americans are concentrated. The practice of redlining has had a long term impact on segments of our community that has yet to be resolved.

1930s redlining impacts African American communities today
1930s redlining still impacts African American communities 90 years later.

Makello is an advocate of green transportation options, providing FREE Energy Savings Estimate services including an analysis of potential electric vehicles to fit your needs, so it was only natural we take a look access to public charging stations African Americans have in the former redlined areas. The results were………….. well, see for yourself.

Few public EV chargers are in African American communities
Less than 10 public electric vehicle charging stations are located within the African American communities.

The data from the US Dept. of Energy Alternative Fuels Data Center may be mapped and compared to the CalEnviroscreen Demographic Data. The neighborhoods with the highest concentrations of African American Residents  do not have easy access to public electric vehicle charging stations. One consequence is this discourages San Diegans with electric vehicles living outside these communities from driving to businesses in these neighborhoods and spending money. The lack of access to public charging stations also discourages the residents of these neighborhoods from purchasing electric vehicles because they don’t have the ability to conveniently charge their vehicle. This is especially true for multi-unit dwellers where there are structural and parking challenges to overcome when installing EV charging stations. This creates additional barriers to EV ownership, keeping the community from reducing pollution, developing business opportunities, and creating jobs in their neighborhoods.

Book an appointment to receive Makello’s Ethical Energy Savings Report, which is the result of a detailed trade-off study of discount utility rates, grants, rebates, tax credits, and equipment options, to determine the fastest payback and highest return on investment to meet your home, business and vehicle energy needs.

The fee for the Ethical Energy Savings Report is refundable (less the 3rd-Party $15 utility data access charge) or credited towards our installation services, after you attend the presentation meeting and complete a 5 minute survey after permission to operate.

Includes up to 5 hours research by the Makello team, and 1 hour Q&A, by Makello’s Ethical Energy Efficiency Expert.

We’re shifting gears now and will be examining the energy cost burden in the City of San Diego. The energy cost burden data was obtained from the 2019 San Diego Climate Equity Report and overlaid the demographic data from the CalEnviroscreen 3.0. Generally speaking, the energy cost burden was calculated as a weighted average for each census tract and divided by the median household income for each census tract to obtain the energy cost burden score. For more detailed explanation of the energy cost burden, please visit the San Diego Climate Equity Report page.

The white outlined areas in the map posted below have the lowest energy cost as a percentage of Median Household Income and the dark green areas have the highest energy cost burden. Most of the African American San Diegans are in the minty green areas and have an energy cost burden of 1.3%- 2.7%. There is one area with 18-28% of the African American residents and a 4-5.4% energy cost burden.

This cost puts an additional financial strain on those residents with more modest incomes and often prevents the residents from using air conditioning or heaters in bad weather, increasing some health risks especially for elderly and health challenged individuals. Or the residents may use older, less energy efficient equipment, increasing energy cost and pollution. 

Energy cost impacting African American communities.

One potential solution for reducing the energy cost burden and pollution is solar energy and battery storage. We mapped solar adoption rates from the San Diego 2019 Climate Equity Index report and again, overlaid the demographic data from CalEnviroscreen 3.0. The areas outlined in white have the least access to solar energy. Many African Americans are living in areas where at best, there are per capita 0.05 solar photovoltaic systems resulting in these residents having a low ability to decrease pollution due to electricity production and consumption in the home, reducing overall energy cost, and protecting against power outages.

African American communities have low access to solar energy
African American communities in San Diego have low access to solar energy systems.

Returning to redlining, banks’ historical unwillingness to loan money in these communities have left many residents underbanked and underserved. Solar Systems, Electric Vehicles, Battery Storage Systems are investments that can improve personal finances and the quality of life for anyone that can afford a purchase, or qualify for financing.  Beyond traditional loans or leases, community members can use the State of California’s Property Assessed Clean Energy (PACE) financing for home upgrades and energy upgrades. PACE is not a loan and does not appear on an individual’s credit report. PACE funds are repaid on the annual property tax bill.

This concludes our discussion for now. Please stay tuned for additional articles where we take a look at other issues and demographic segments of San Diego Residents. 

Book a FREE 15 minute appointment to: 1) Find out how Makello can help you. 2) Discuss your energy needs. 3) Get a FREE Energy Savings Estimate.

To learn more about Makello, click on the videos below.

solar power, energy storage, electric vehicles
Welcome to Makello!
utility black out battery back up power
Where Will You Be In The Next Blackout?
battery backup power 2020
Get On The Road To Energy Independence!

Credits:

Caltrans https://dot.ca.gov/

OEHHA- https://oehha.ca.gov/calenviroscreen

University of Richmond Digital Scholarship Lab https://dsl.richmond.edu/panorama/redlining/#loc=12/32.776/-117.29&maps=0&city=san-diego-ca&area=D4

City of San Diego 2019 Climate Equity Report https://www.sandiego.gov/sites/default/files/2019_climate_equity_index_report.pdf

Health Resources & Services Administration https://www.hrsa.gov/

USGS https://www.usgs.gov/

SanDAG https://www.sandag.org/index.aspsubclassid=100&fuseaction=home.subclasshome

California Open Data Portal https://data.ca.gov/

Census Bureau  https://www2.census.gov/programssurveys/acs/methodology/design_and_methodology/acs_design_methodology_ch06_2014.pdf

US Department of Energy Alternative Fuels Data Center https://afdc.energy.gov/stations/#/find/nearest

APA STyle Racial and Ethnic Guidelines https://apastyle.apa.org/style-grammar-guidelines/bias-free-language/racial-ethnic-minorities

American Heritage Guide to Usage and Style- Person of Colour https://zourpri.files.wordpress.com/2014/01/the-american-heritage-guide-to-contemporary-usage-and-style-2005.pdf

Is the Term “People of Color” Acceptable in This Day and Age? https://www.sapiens.org/column/race/people-of-color/

Are Asian Americans White? Or People of Color? https://www.yesmagazine.org/social-justice/2020/01/15/asian-americans-people-of-color/

‘People of Color’ are protesting. Here’s what you need to know about this new identity. https://www.washingtonpost.com/

The Perils of “People of Color” https://www.newyorker.com/news/annals-of-activism/the-perils-of-people-of-color

Where did BIPOC Come From? https://www.nytimes.com/article/what-is-bipoc.html

Center for Sustainable Energy EV101 Webinar Series

Electric Vehicle Public Charging Station

Makello is a program featured guest presenter and video educator for the community, speaking about EVs, discount utility rates, making money with energy storage, enhanced incentives for qualified individuals, charger types, public charging, home charging, grants, rebates, incentives and many clean air benefits.

Book a FREE 15 minute appointment to: 1) Find out how Makello can help you. 2) Discuss your energy needs. 3) Get a FREE Energy Savings Estimate.

On August 4, we premiered our Public EV charging demonstrations and interviews for the CSE‘s Clean Vehicle Rebate Project webinar series presentations, in cooperation with Groundwork San Diego. The videos are the first of an EV101 educational video series. Click on the images below to view the EV101 Public and Home Charging Videos.

Electric Vehicle Public Charging Station
EV101 Public Charging
https://www.youtube.com/watch?v=khHYpqB5WnQ
Electric Vehicle Home Charging Station
EV101 Home Charging
https://www.youtube.com/watch?v=cJKqHfpXQ38

Finding a Charger Online 

Example: EVgo Level 2

  1. Visit EVgo.com
  2. Click on Find a Fast Charger
  3. Search for an address
  4. Filter for charger type (Level 2 J1772; Chademo, CCS, Tesla)
  5. Click on a charger station to select.
  6. Get directions
  7. Confirm charger information (Is it Available?)
  8. Drive to location
EVgo charging station outside of Northgate Market.
EVgo charging station outside Northgate Market. Makello hosted a booth to educate the community about Plug-In Vehicle benefits and affordability at the grand opening of this charging station in July of 2019.

There’s certain things you need to know before you choose a public charger location.

  • Brand – Which EV Public Charger company to use?
  • Cost ($/kWh) – Membership or Subscription?
  • Distance / Location – Is it convenient for my commute or driving route?
  • Connector Type – Is it compatible with my vehicle?
  • Speed – Level 1, 2 or 3?
  • Availability – Is there a charger available at the desired time?
  • Range – Is it fast enough to charge the battery to a desired level, if it is time limited?

Brand 

Search online to compare Public EV Charging companies in San Diego.

Cost

Public EV Charging companies may charge a membership fee, monthly subscription or a la carte cost/kWh.  The end cost varies, but is usually between $0.25/kWh – $0.35/kWh, which is roughly $2.50-$3.50/gallon gas cost equivalent.

Distance / Location

Use the App to choose a Charger that is convenient for my driving and parking habits and destinations.

Book an appointment to receive Makello’s Ethical Energy Savings Report, which is the result of a detailed trade-off study of discount utility rates, grants, rebates, tax credits, and equipment options, to determine the fastest payback and highest return on investment to meet your home, business and vehicle energy needs.

The fee for the Ethical Energy Savings Report is refundable (less the 3rd-Party $15 utility data access charge) or credited towards our installation services, after you attend the presentation meeting and complete a 5 minute survey after permission to operate.

Includes up to 5 hours research by the Makello team, and 1 hour Q&A, by Makello’s Ethical Energy Efficiency Expert.

Connector Type

There are 4 Connector Types: Tesla, CHAdeMo, CCS Combo or J1772.  Not every charging location supports all 4 of them. That’s why it’s important to compare charger locations beforehand – Is it compatible with my vehicle?

There are 4 Connector Types Tesla, CHAdeMo, CCS Combo, J1772
There are 4 Connector Types: Tesla, CHAdeMo, CCS Combo or J1772.

Speed – Level 1, 2 or 3.

  • Level 1 is the slowest AC charging and uses common household current, 120v, 3 prong outlet: 1.5kW (Up to 2kW).  The purpose is overnight charging or for long parking duration.
  • Level 2 charges faster than level 1 and would be ideal for 4-5 hours spent at the mall (J1772 connector): AC Fast Charging (Up to 19kW)  The purpose is overnight fast charging, convenience fast charging or for short-medium parking duration.
  • Level 3 is DC fast charging. Think about stopping to charge your vehicle on a long road trip while grabbing a 30 minute lunch. (CHAdeMO or CCS Combo): (Max power 400 kW)  The purpose is fastest charging for the shortest duration.

Reservations / Availability

Use the App to see if a location that supports my vehicle’s connector type is available and reserve it!

Are you ready to save money on solar power, EV charging or Energy Storage? Get an instant quote from Makello!

Range

  • The faster the charge speed, the longer the EV driving range.
  • Is it fast enough to charge the battery to a desired level, if it is time limited?
  • Public chargers are often time limited to 30 minutes – 60 minutes of charging. Just enough time to grab lunch at the mall!
  • Businesses like malls, movie theaters and casinos expect longer charging periods, so you can find locations to charge up from empty to full on Level 2 or Level 3.

If you can’t find a conveniently located public EV Charger, then “Request A Public EV Charger” – put a pin on the map to suggest a location for future consideration.

electric vehicle charging station san diego

For more information on Plug-In Vehicles, visit Makello.com > Plug-In Vehicles, or to see how much you can save, visit Plug-In Vehicle Savings Calculator.

Makello Research Assistant in UCSD ESYS Capstone

AuroraSolar solar design model energy analysis irridiance

I was going into my last quarter of undergrad at UCSD when I started interning at Makello. The internship was part of my Senior Project, and I enjoyed working with a diversely skilled team.  I worked with people with experience in many fields including software/electrical engineering, solar installation, non-profit organizations, management experience, and GIS systems all united by a common goal: clean energy.

I recently completed my B.S. in Environmental Systems and Earth Sciences with a minor in Marine Sciences. I am pursuing a career to combat climate change to preserve our planet as we know it, but there is also a part of me that feels a societal obligation to help elevate the standard of living (if they want it) for people who do not have equal access to opportunities such as education, community resources, healthy foods, etc. I believe we live in a society to take care of each other, and generally, disadvantaged communities could use additional resources, so I was excited to work with a company that works closely with non-profit organizations, especially non-profits in disadvantaged communities, such as Groundwork San Diego. I am thrilled to be in a position, right out of college, where I can help combat both social and environmental justice.

Makello Team City Heights 5k run
The Makello Team (left to right) Agustin, Ola, Linda, Charlie

During my internship, we attended many events as both attendees and presenters, sometimes with Groundwork San Diego or our solar installation team. Examples of events were community activities, such as organized runs or home and garden shows, where we would provide information about electric vehicles and solar. We also attended car shows and electric vehicle focused events to stay current with new electric vehicle technology and to help explain their benefits to the public.

Click here to see how I discovered Makello.  

Book a FREE 15 minute appointment to: 1) Find out how Makello can help you. 2) Discuss your energy needs. 3) Get a FREE Energy Savings Estimate.

Part of my initial training was how to use solar design and cash flow analysis software, the site survey measurements and the customer’s goals to determine the Optimal System Size. I grew up doing home remodels and renovations during summers, so I enjoyed visiting different homes and seeing different styles of architecture and landscaping throughout San Diego. It was cool to see some existing solar arrays that customers had already installed too. It was also nice to be able to put a face to the customers whose proposals we were working on. 

Working on customer proposals and site surveys was my favorite part of the internship because it was a combination of computer design and modeling, hands on physical labor, and critical and analytical thinking. I still enjoy the same work, but now my Research Assistant position is 100% remote because we follow CDC guidelines to keep ourselves and our community safe. We used Makello’s software model to create the custom trade-off study proposals for each customer and automatically generate the correct price, ethically, without sales gimmicks.

Makello’s honesty and knowledge of energy efficiency, utility rates, solar power, electric vehicles, and battery storage, as well as assessing the needs of individual customers and their families, is what drives the high win rate with customer proposals.  On more than one occasion, customers wanted to purchase more solar than they needed, or wanted a battery because they believed it would increase cost savings. Using Makello’s model, our team showed that, in fact, a smaller solar system is needed if replacing inefficient appliances, or changing the times the appliances are in use.

I was excited to work on a diversely skilled team to create community pages for our website. We ended up creating a valuable tool with important information and graphics for San Diego communities. The pages had GIS Maps that displayed information on a variety of issues such as air quality, electric vehicle charging station locations, rebate eligibility, etc. We also included a list of different rebates and incentives for solar, electric vehicles and battery storage as well as information as to why they are beneficial to the environment and how they can save money. Click here to view the community pages. 

Are you ready to save money on solar power, EV charging or Energy Storage? Get an instant quote from Makello!

Makello Aids NPOs & NGOs in Environmental Justice

EV Association of SD at Groundwork San Diego’s EarthLab

I met Charlie, the CEO and founder of Makello, during the summer while I was interning at Groundwork San Diego’s EarthLab in partnership with UC San Diego’s Center on Global Justice. While at the EarthLab, I was a college mentor for Groundwork’s High School Green Team. We were learning about electric vehicles, and Charlie was one of the guests who volunteered his time to come speak to us about the benefits, technology, and affordability of Plug-In Vehicles.

Book an appointment to receive Makello’s Ethical Energy Savings Report, which is the result of a detailed trade-off study of discount utility rates, grants, rebates, tax credits, and equipment options, to determine the fastest payback and highest return on investment to meet your home, business and vehicle energy needs.

The fee for the Ethical Energy Savings Report is refundable (less the 3rd-Party $15 utility data access charge) or credited towards our installation services, after you attend the presentation meeting and complete a 5 minute survey after permission to operate.

Includes up to 5 hours research by the Makello team, and 1 hour Q&A, by Makello’s Ethical Energy Efficiency Expert.

The first time I met him was with the Electric Vehicle Association of San Diego. Charlie and other members of the EV Association came to the EarthLab and spoke to us about electric vehicles, their experiences with them, why they loved them, and allowed us to ride along in their vehicles!

EV Association of SD at Groundwork San Diego’s EarthLab
Charlie and other members of the Electric Vehicle Association of San Diego met with Groundwork San Diego’s High School Green Team.

Charlie volunteered his time on four occasions during the four week program. The second time I met him, he and Songxuan came to the EarthLab to do a solar and electric vehicle demonstration. We used solar ovens, metal sheets that reflect sunlight into a concentrated location, to heat up solar chili and cornbread. It was so good! He also gave us a quick presentation on “What to Know About Plug-In Vehicles”. The presentation was really cool because he demonstrated how the car, a MINI Countryman Plug-In Hybrid, could be used as a battery bank, using it to power the laptops and monitor, and explained how solar could charge up the car. We also got to look at the battery packs for his converted Plug-In Prius.

You don’t need a ton of solar to save money.

During his presentations to us, he acknowledged that he was a small business owner, but never tried to sell us on his products. Instead he explained how the technology worked, why the technology is more environmentally and community friendly, and how the technology could, in fact, be made affordable to families in disadvantaged communities. Solar and electric vehicle adoption contributes to safer, cleaner communities. Less greenhouse gases and smog are emitted from cars and power plants, leading to better air quality in communities.

Northgate Market Public EV Charging Stations grand opening
Makello, Groundwork San Diego, and EVgo grand opening at Northgate Market at 1410 S 43rd St, San Diego, CA 92113; 4 CCS/SAE 50kW and 5 CHAdeMO 50kW EV Chargers.

Book a FREE 15 minute appointment to: 1) Find out how Makello can help you. 2) Discuss your energy needs. 3) Get a FREE Energy Savings Estimate.

Charlie was also at the grand opening of the EVgo public charging stations at Northgate Market in the Chollas Creek Community that Groundwork helped sponsor and EarthLab’s Green Team attended.

Groundwork San Diego EarthLab presentation UCSD internship
The final presentation for my Groundwork San Diego/EarthLab internship that Charlie attended. Also in attendance were UCSD professors, Groundwork San Diego staff, EVgo staff, and Chollas Creek Community members.

Charlie also attended the final presentation for my summer internship at Groundwork San Diego. I appreciated how Charlie volunteered so much of his time to EarthLab and the Green Team, and I could see myself working for someone whose business motivation does not come from maximizing profits, but is rooted in education, conservation, and community well being. I exchanged contact information and soon had an internship with Makello! More information about my Makello internship is available here.