
What changed with SDG&E rates?
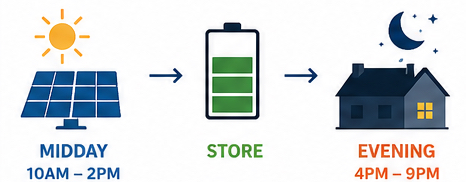
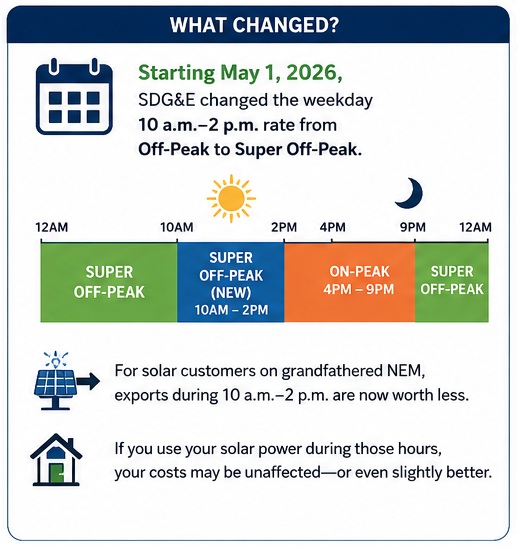
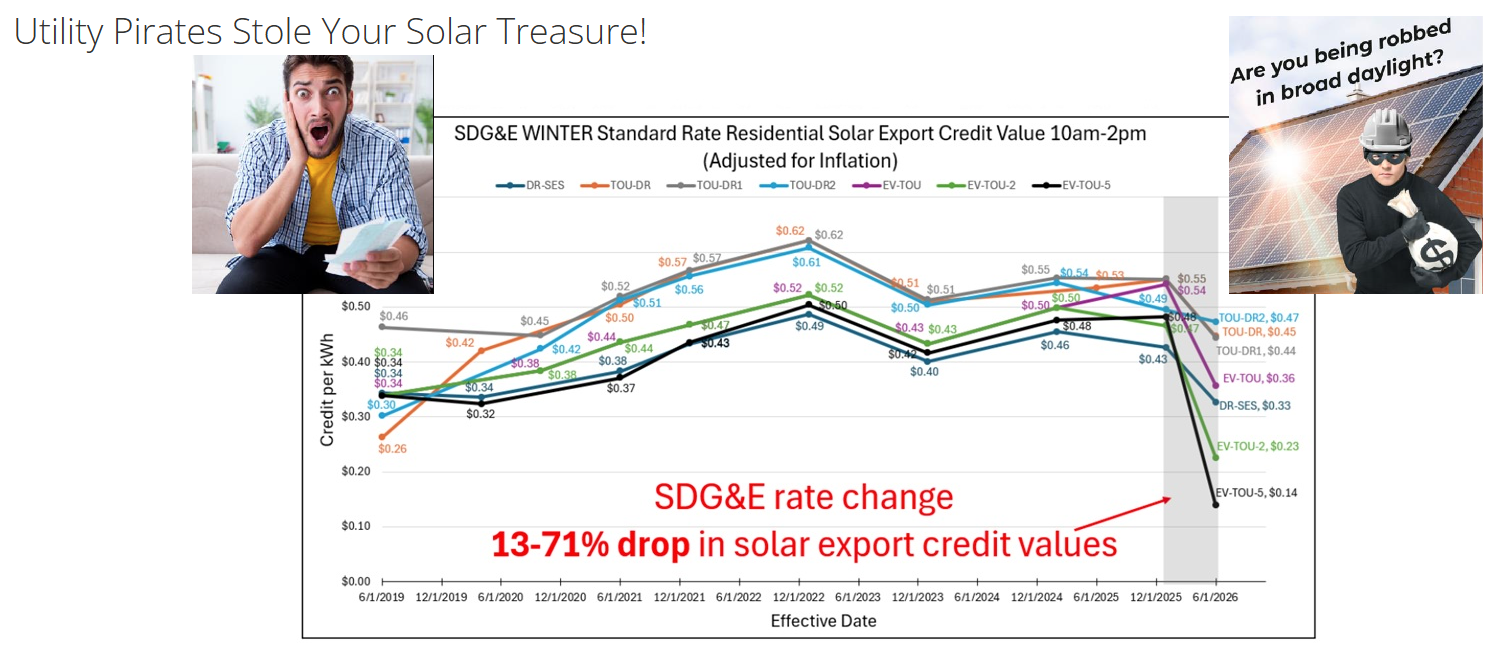
Effective May 1, 2026, SDG&E replaced the weekday Off-Peak rate with Super Off-Peak rate between 10am and 2pm year round. Previously those midday solar peak production hours were credited for Export to SDG&E at Off-Peak rate credit value, in every month except March and April. SDG&E On-Peak rate remains 4pm to 9pm. Weekends remain on the same Super Off-Peak rate as before during midday 10am-2pm.
For a customer on grandfathered Net Energy Metering (NEM) tariff, moving the lowest cost Super-Off Peak rate to the peak solar production hours cuts the export value. Accounts with loads that consume solar power midday instead of exporting solar power to SDG&E, are unaffected or slightly better off, because the cost of importing electricity during those hours became cheaper.
SDG&E 10am-2pm Super Off-Peak Rate Change: Measured Impact Across the Customer Base
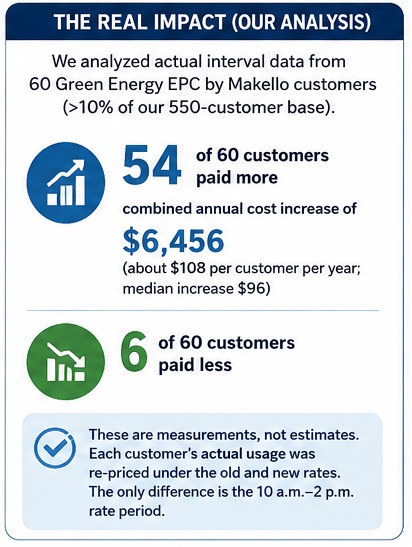
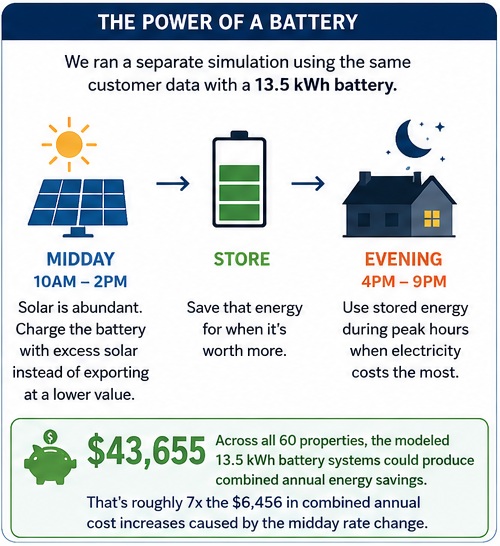
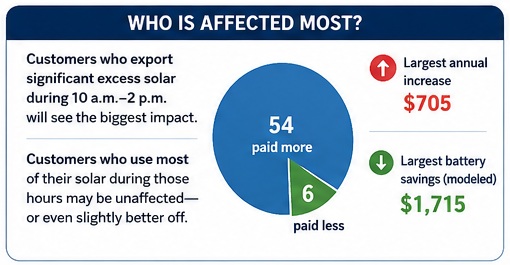
The Center for Community Energy and Makello.com analyzed 60 Green Energy EPC by Makello installed solar or solar-battery customer’s SDG&E metered interval data, which is slightly more than 10% of Green Energy EPC by Makello’s 550 installed customer base. Fifty-four of the 60 accounts analyzed will pay more because of the change SDG&E made on May 1, 2026, and only 6 pay less. The combined increase is $6,456 a year, however the same 60 properties would save $43,655 a year with the addition of a 13.5kWh battery, which is about 7 times the cost of the Super Off-Peak midday period change that decreased the Solar Export Credit Value.
How were the numbers produced?
Each premise’s own metered intervals were re-priced twice, once under the Off-Peak rate, and once under the Super Off-Peak rate. The electric load, utility rate and the solar or solar-battery system are the same in both runs. The only difference is which SDG&E rate the midday hours fall, so the difference between the two runs is caused by the period change and by nothing else. These are measurements, not estimates.
Under Net Energy Metering (NEM), each period’s net kilowatt hours (kWh) settles at that period’s generation rate. Delivery is close to flat across periods and earns no credit on export, so it is unaffected by the change and drops out.
Did SDG&E devalue your solar export credits in ‘Midday Super Off-Peak’ rate change? Find out: send a utility bill PDF, Interval data CSV to info@makello.com
The whole bill moves by the amount shown below.
| Source | Number of Meters Measured | Number with higher SDG&E bill | Annual Cost Increase |
|---|---|---|---|
| Green Button | 11 | 11 | $1,253 |
| UtilityAPI | 49 | 43 | $5,203 |
| Combined | 60 | 54 | $6,456 |
The potential add-on battery figure is a separate simulation on the same interval data, for charging the battery from solar surplus, and discharging the battery against the 4pm to 9pm Peak Rate.
| Annual increase for Existing Solar SDG&E Accounts | Number of Meters Measured | Annual Utility Cost Increase for 10am-2pm | Add-On Battery Annual Savings for 10am-2pm |
|---|---|---|---|
| Over $300 | 1 | $705 | $1,715 |
| $200 to $300 | 4 | $1,017 | $4,653 |
| $100 to $200 | 23 | $3,265 | $19,104 |
| $50 to $100 | 20 | $1,530 | $14,269 |
| Under $50 | 12 | -$61 | $3,914 |
Every measured meter, sorted by Annual Cost Increase
| Customer | City | CCA | Schedule | Super Off-Peak rate change Cost / (Benefit) per year 10am-2pm | Potential Annual Battery Cost Savings 10am-2pm (13.5 kWh example) |
| C.B. | El Cajon | SDCP | DR-SES | $705 | $1,715 |
| E.L. | Encinitas | SDCP | TOU-DR | $288 | $1,000 |
| D.D. | San Diego | SDCP | DR-SES | $267 | $1,702 |
| P. F. | Encinitas | SDCP | DR-SES | $236 | $810 |
| E.W. | Escondido | CEA | DR-SES | $226 | $1,141 |
| K. J. | La Mesa | SDCP | TOU-DR1 | $194 | $728 |
| M.D. | Escondido | SDCP | DR-SES | $191 | $807 |
| B.B. | Oceanside | CEA | EV-TOU-5 | $188 | $970 |
| R.C. | Oceanside | CEA | TOU-DR1 | $183 | $625 |
| C.D. | Carlsbad | CEA | DR-SES | $180 | $683 |
| C.P. | Alpine | SDCP | TOU-DR1 | $172 | $1,103 |
| L.W. | San Diego | SDCP | DR-SES | $168 | $509 |
| S.P. | La Jolla | SDCP | DR-SES | $157 | $1,351 |
| G.S. | San Diego | SDCP | EV-TOU-5 | $156 | $873 |
| R.W. | San Diego | SDCP | TOU-DR1 | $154 | $1,032 |
| J.Z. | Escondido | CEA | TOU-DR1 | $150 | $1,164 |
| C.C. | San Diego | SDCP | EV-TOU-5 | $131 | $1,208 |
| D.M. | Encinitas | SDCP | DR-SES | $127 | $768 |
| G.B. | San Diego | SDCP | DR-SES | $124 | $1,180 |
| R.D. | El Cajon | SDCP | TOU-DR1 | $118 | $661 |
| O.T. | San Diego | SDCP | DR-SES | $113 | $938 |
| E.H. | La Mesa | SDCP | DR-SES | $113 | $568 |
| S.B. | Chula Vista | SDCP | DR-SES | $113 | $482 |
| M.D. | Rancho Santa Fe | SDCP | EV-TOU-5 | $112 | $864 |
| R.G. | Fallbrook | SDCP | TOU-DR1 | $110 | $393 |
| J.G. | San Diego | SDCP | EV-TOU-5 | $106 | $956 |
| A.K. | San Diego | SDCP | TOU-DR1 | $104 | $658 |
| S.M. | Encinitas | SDCP | EV-TOU-2 | $101 | $583 |
| T.W. | Encinitas | SDCP | TOU-DR1 | $99 | $638 |
| L.G. | Carlsbad | CEA | EV-TOU-2 | $96 | $544 |
| D.Y. | Encinitas | SDCP | TOU-DR1 | $96 | $698 |
| D.M. | Encinitas | SDCP | EV-TOU-5 | $89 | $254 |
| E.M. | Carlsbad | CEA | TOU-DR | $89 | $814 |
| C.C. | Escondido | SDCP | TOU-DR1 | $89 | $900 |
| J.S. | La Jolla | SDCP | DR-SES | $88 | $430 |
| J.O. | Encinitas | SDCP | TOU-DR | $85 | $974 |
| M.M. | Encinitas | SDCP | EV-TOU-5 | $80 | $951 |
| C.W. | San Diego | SDCP | DR-SES | $79 | $675 |
| E.B. | San Diego | SDCP | TOU-DR1 | $76 | $634 |
| E.S. | Encinitas | SDCP | TOU-DR1 | $76 | $877 |
| D.M. | San Diego | SDCP | EV-TOU-2 | $74 | $797 |
| S.G. | La Mesa | SDCP | DR-SES | $72 | $1,041 |
| N.G. | Encinitas | SDCP | TOU-DR1 | $68 | $628 |
| T.G. | Escondido | SDCP | DR-SES | $57 | $639 |
| D.S. | Encinitas | SDCP | TOU-DR | $56 | $587 |
| A.J. | Encinitas | SDCP | EV-TOU-5 | $55 | $655 |
| A.S. | Encinitas | SDCP | DR-SES | $53 | $971 |
| A.B. | San Diego | SDCP | TOU-DR1 | $53 | $562 |
| L.B. | San Diego | SDCP | EV-TOU-5 | $43 | $460 |
| J.P. | El Cajon | SDCP | TOU-DR1 | $39 | $642 |
| C.P. | San Diego | SDCP | TOU-DR1 | $38 | $923 |
| P.H. | San Diego | SDCP | TOU-DR1 | $35 | $360 |
| T.U. | Spring Valley | SDCP | DR-SES | $26 | $84 |
| D.G. | Encinitas | SDCP | TOU-DR1 | $12 | $437 |
| S.M. | Vista | SDCP | TOU-DR1 | ($1) | $299 |
| B.R. | Del Mar | CEA | TOU-DR1 | ($4) | $214 |
| C.B. | Carlsbad | CEA | DR-SES | ($9) | $12 |
| B.G. | La Jolla | SDCP | TOU-DR1 | ($27) | $349 |
| A.A. | Encinitas | SDCP | TOU-DR1 | ($63) | $40 |
| A.E. | La Jolla | SDCP | EV-TOU-5 | ($150) | $94 |
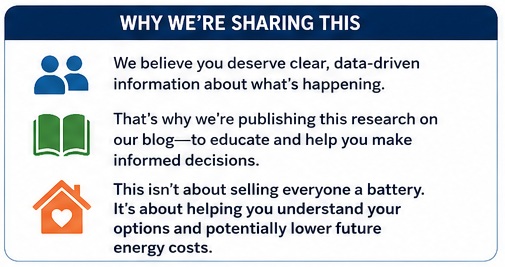
What the numbers say- Only midday exporters are hurt, making a battery even more useful
The median SDG&E increase is $96 a year and the mean is $108. Clean Energy Alliance(CEA) customers are hit harder per meter, on average $122 annual increase, vs $105 annual increase for San Diego Community Power(SDCP) generation customers. The reason for the difference between the two Community Choice Aggregators (CCA) is because the gap between Clean Energy Alliance’s(CEA’s) Off-Peak and Super Off-Peak rates is wider than the gap between San Diego Community Power’s(SDCP’s) Off-Peak and Super Off-Peak rates.
Only 6 utility meters are better off with the midday rate change, by as much as $150 a year, because they import or self consume at midday instead of exporting, so cheaper Super Off-Peak rate helps them. The dividing line is whether the array is sending excess solar power to the grid at midday, or otherwise that the electric loads are consuming the solar power. A battery is a load that absorbs the excess solar production and stores it for use later when utility rates are higher, or when there is a utility outage.
How each customer’s CCA was determined
The generation provider matters, since Clean Energy Alliance(CEA) and San Diego Community Power(SDCP) price the affected hours differently. The pricing difference was resolved two ways. First, the best resolution is reading the generation supplier from their own bills. From our sample data, forty-one of the forty-nine UtilityAPI meters’ intervals were read directly from the supplier named on their own bills. That is ground truth and needs no assumption. The remaining 8 were assigned by town, on the basis that Community Choice Aggregator(CCA) membership enrollment is automatic and only 1%-2% of customers choose to opt out.
The town to CCA map was derived from the bills of the other customers rather than from general knowledge, then checked against the identified customer. Cross checking the data this way caught two errors. The word Vista appears inside Chula Vista, which would have put seven San Diego Community Power customers into Clean Energy Alliance. Escondido turns out to be genuinely mixed, with both suppliers serving different Escondido addresses in the bill data, so the Community Choice Aggregator (CCA) cannot be reliably assigned solely by town name. Escondido and Vista addresses default to SDCP if billing information is not available, which produces a more conservative result.
Data that was excluded from our sample and why
Nine meters were not included in the analysis. Five meters did not have any interval data. Two meters did not have a resolvable supplier or a recognisable town indicated on their interval data. One meter is served by a third party rather than a CCA so these rates do not apply, and one meter was a duplicate.
Additionally, twenty solar exporters are on tiered or two period schedules that the recent SDGE Super Off Peak Hours change does not impact. Two solar exporters are on tariffs that could not be classified. Where a premise had several meters over time, through a meter change or a replacement, only the most recent was counted. For example, three different meters over time at one address would otherwise have counted that customer three times.
Analysis Assumptions
Whenever the numbers above are quoted we used annual netting rather than monthly banking with a true up. With regards to the battery impact, battery dispatch is a simple rule, charge from surplus and discharge against the on peak window, so it is a working figure rather than an optimised one. Delivery is treated as flat across periods, which the bills support. Battery savings are gross energy savings before equipment cost, so they are a savings side and not a payback. Where a customer’s interval history is shorter than a year, we scaled the result to a year, and the number of days behind each figure is in the underlying data.
Key Takeaways
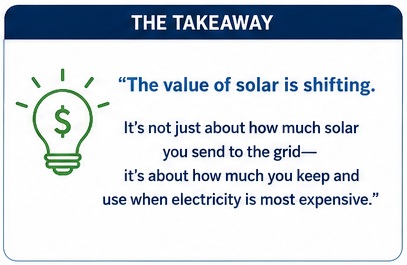
California has the enviable position of producing so much excess solar at noon that there often aren’t enough loads to utilize the solar production being pushed out to the grid. Switching from a spinning the meter backwards to earn credits mindset to using a battery to capture excess production and discharge the battery during on-peak periods can be a game changer for solar customers now that those midday export credits have been devalued.
The goal is no longer to indiscriminately export excess to the grid during high solar production periods but rather to utilize energy storage to hold excess production onsite and discharge the battery during the periods of the day with the most expensive rates with onsite loads prioritized before excess is exported to the grid.
Thank you, Jose and Center for Community Energy, for the excellent research and analysis!
How much did SDG&E devalue your solar export credits in ‘Midday Super Off-Peak’ rate change? Find out: send a utility bill PDF, Interval data CSV to info@makello.com
Don’t know how to find your data?
Click here for a guide or here for a video.
Makello is an authorized distributor for Green Energy EPC by Makello, Inc. CA Lic #1110498